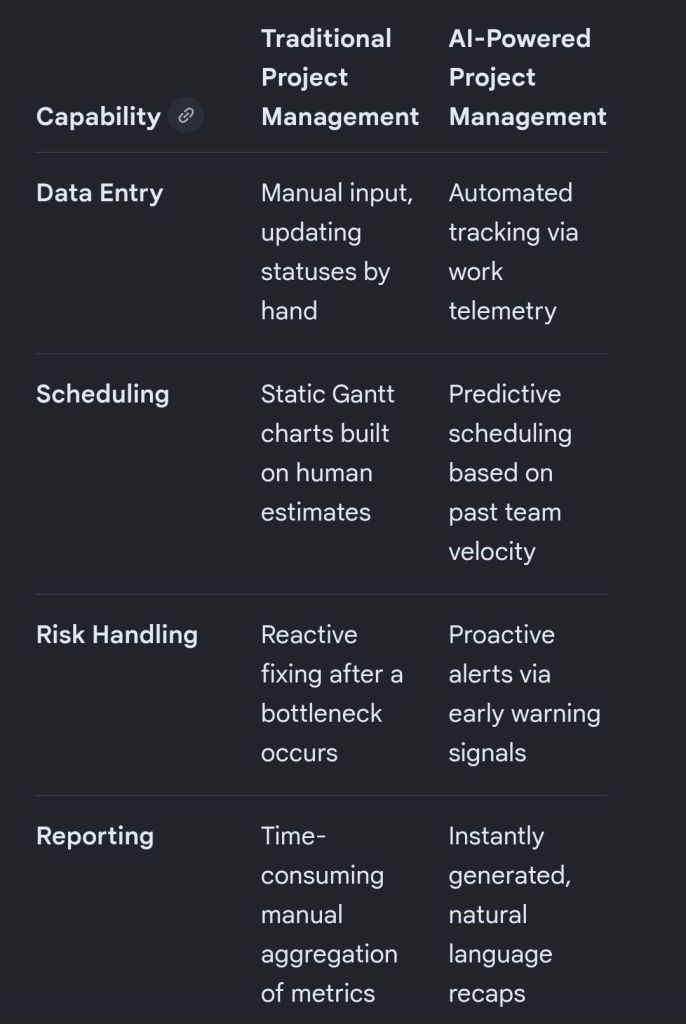
Artificial intelligence is transforming project management by shifting software from passive data repositories into active, predictive engines that automate tedious administration and improve decision accuracy.
The breakdown below covers the primary AI approaches and the specific tools driving each function.
🧠 Core AI Approaches in Project Management
Rather than basic, rule-based automation (“if X happens, do Y”), true AI uses model-driven machine learning, natural language processing (NLP), and predictive analytics.
Predictive Analytics & Forecasting: Machine learning models evaluate past team velocity, budget trends, and historical timelines to forecast delays and cost overruns before they occur.
Natural Language Processing (NLP): Large Language Models (LLMs) digest unstructured data like unstructured chats, customer emails, and meeting transcripts to extract action items, drafting project updates automatically.
Resource Optimisation: Algorithms match team members’ skills, existing workloads, and availability with upcoming project requirements to distribute work sustainably and efficiently.
Proactive Risk & Scope Creep Detection: AI monitors real-time activity and flags deviations from the initial project charter, alerting teams to emerging bottlenecks.
🛠️ AI Project Management Tools Broken Down by Use Case
1. All-in-One Work Operating Systems (Work OS)
These comprehensive platforms integrate AI deeply into everyday task tracking, workflows, and communication.
Monday.com: Features an integrated AI Assistant that auto-generates task descriptions, brainstorms project ideas, and summarizes long activity threads across cross-functional workspaces.
ClickUp: Uses its unified “ClickUp Brain” engine to break down major project milestones into contextual subtasks, answer project-related queries instantly, and write status updates.
Asana: Leverages AI smart agents to recommend task assignments, identify workflow blockers early, and suggest ideal task prioritisation based on team capacity.
Wrike: Focuses heavily on predictive analytics and intelligent insights, allowing larger organisations to move past traditional tracking into data-driven risk monitoring.
2. Meeting & Communication Intelligence
These tools alleviate the administrative burden of manually taking notes, tracking ownership, and summarizing align-meetings.
Otter.ai: Transcribes team calls in real time and automatically creates bullet-point action items, keyword summaries, and structured meeting recaps.
Microsoft Copilot / Google Gemini: Seamlessly pulls historical data from your workspace ecosystem (emails, documents, calendars) to draft project charters or assemble stakeholder reports with minimal context.
3. Engineering & Agile Backlog Management
Built to address the rapid velocity changes and technical needs of software development teams.
Jira (Atlassian Rovo): Uses built-in AI agents to organize bloated backlogs, surface conflicting dependencies, and estimate how long features will take based on historical sprint velocities.
4. Document & Knowledge Management
Designed for centralizing organizational resources so teams don’t waste time hunting for internal data.
Notion AI: Acts as a central, conversational wiki workspace that synthesizes notes, translates documents, drafts release notes, and surfaces data buried in complex project databases.
NotebookLM: A powerful, localized research assistant that organizes complex internal project documentation, creates study guides for teams, and answers cross-document queries accurately.
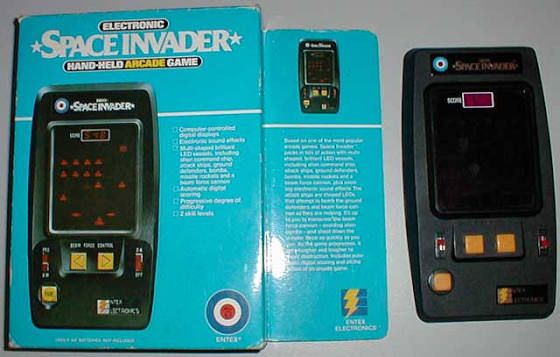
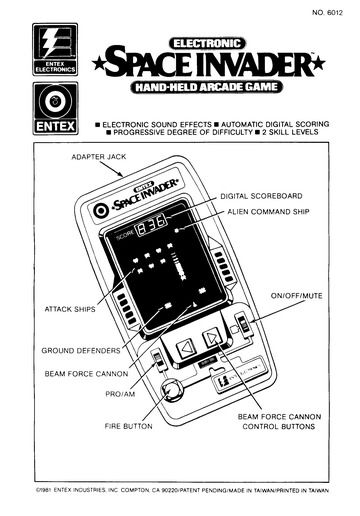
The Entex Space Invader handheld electronic game is a classic VHF-style portable arcade unit released in 1980. It is highly sought after by collectors of vintage 1980s electronics. I used to have one in the early eighties, my first taste of computing technology and gaming.
Design & Hardware
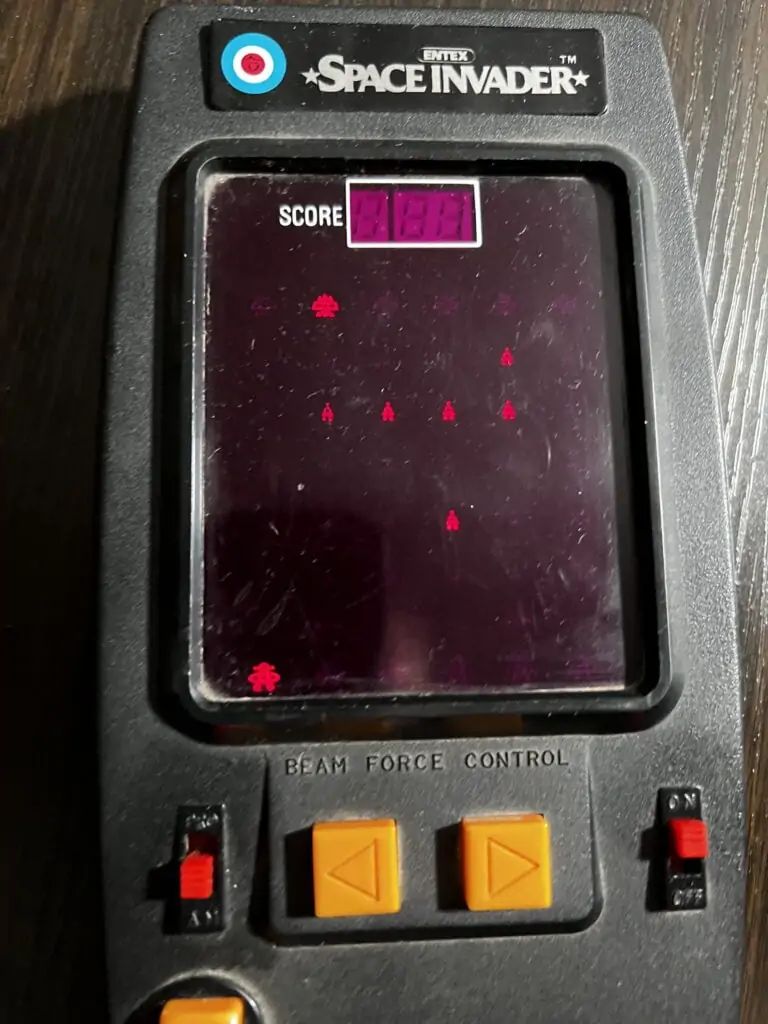
Entex Space Invader handheld electronic game
Form Factor: Large wedge-shaped black plastic tabletop/handheld console designed by Entex Tokyo.
Objective: Move your laser cannon horizontally across the bottom of the screen to shoot down descending waves of alien invaders.
Layout: Displays four distinct lanes of action with columns of moving digital alien targets.
Scoring System: Tracks and displays electronic numeric scoring up to a maximum of 1,000 points.
Audio: Features simple built-in, synthesized electronic space sound effects for firing lasers and alien tracking.
Known Product Variants
1980 Black Model: The original release featuring a dark case, designed and programmed natively in Japan by Entex Tokyo.
1981 Grey Model: A re-programmed version developed by Rick Dyer & AMS featuring slightly adjusted gameplay. The distinct grey casing was actually the result of a factory paperwork typo that swapped two Pantone color codes.
Entex Space Invader handheld electronic game, back of box
The Project Management Templates by Mark Whitfield constitute a comprehensive toolkit of over 200 editable resources designed to accelerate project delivery across Agile, Waterfall, and PRINCE2 frameworks.
The structural breakdown of the core templates is organised by functional category, specific template, integrated Microsoft Office tool, and operational description:
1. Project Planning & Scheduling
Detailed SDLC Project Plan
MS Tool: Microsoft Project (.mpp)
Description: A master schedule structured around the Software Development Lifecycle (SDLC) from development through testing, deployment, and Early Live Support (ELS), easily toggled between Agile Scrum and traditional Waterfall.
PRINCE2 7th Edition Project Plan
MS Tool: Microsoft Project (.mpp) & MS Excel (.xlsm)
Description: Fully annotated task list aligned with the 7th edition principles, colour-coded by activity type (blue for artifact creation, brown for management decisions, purple for updates).
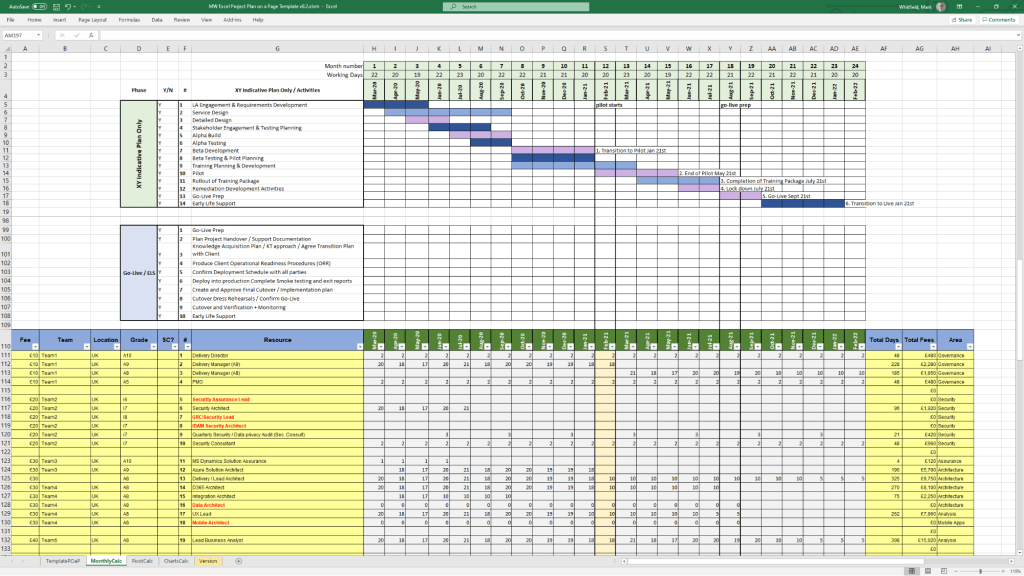
Detailed Waterfall Project Planner
MS Tool: MS Excel
Description: A portable, license-free alternative to MS Project featuring baseline versus forecast tracking, an integrated Gantt chart view, and automated progress charts.
Plan on a Page (POaP)
MS Tool: MS PowerPoint & MS Excel
Description: High-level, executive-ready roadmaps containing over 30 slide variations used to communicate project timelines, key milestones, and work streams to senior stakeholders.
1. Project Planning & Scheduling POAP MS PowerPoint Templates2. Project Planning & Scheduling MS Project Templates3. Project Planning & Scheduling MS Excel Templates
2. Operational Control & Governance
Comprehensive RAID Log & Charts
MS Tool: MS Excel
Description: A highly detailed central registry featuring distinct tabs to track Risks, Actions, Issues, Opportunities, Dependencies, Lessons Learned, and Change Requests alongside visual metric dashboards.
Basic RAIDs Tracker
MS Tool: MS Excel
Description: A scaled-down, simplified version of the master RAID log optimized for quick turnarounds, minor bids, and low-complexity projects.
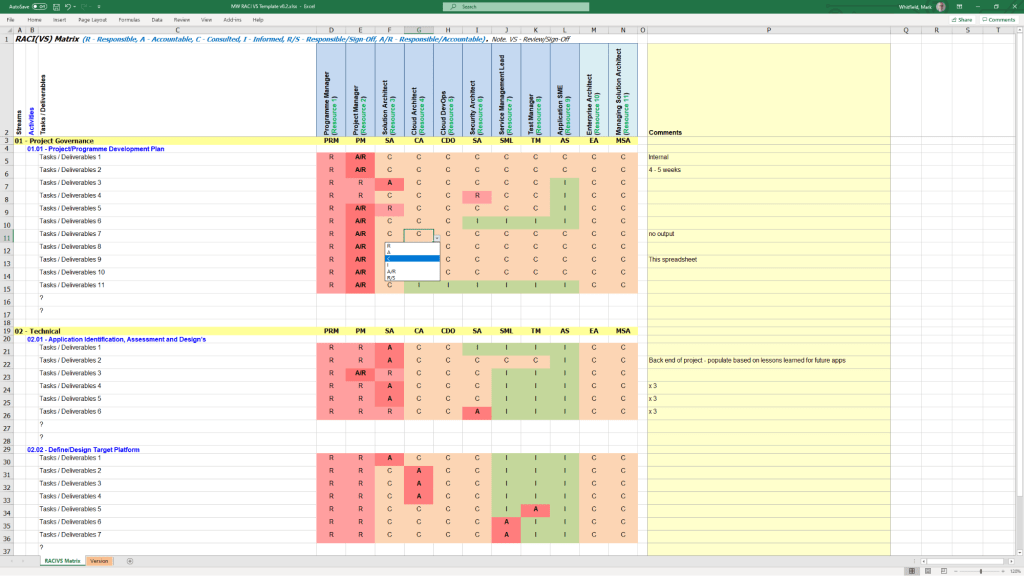
RACI Matrix
MS Tool: MS Excel
Description: A governance sheet mapping project deliverables against specific team roles to clarify who is Responsible, Accountable, Consulted, and Informed.
Agile Story Dependency Tracker
MS Tool: MS Excel
Description: A specialised log to document and track blocker stories tied to external suppliers or client-side dependencies that risk driving scope changes.
1. Operational Control & Governance MS Excel RACI Template
3. Financial & Resource Management
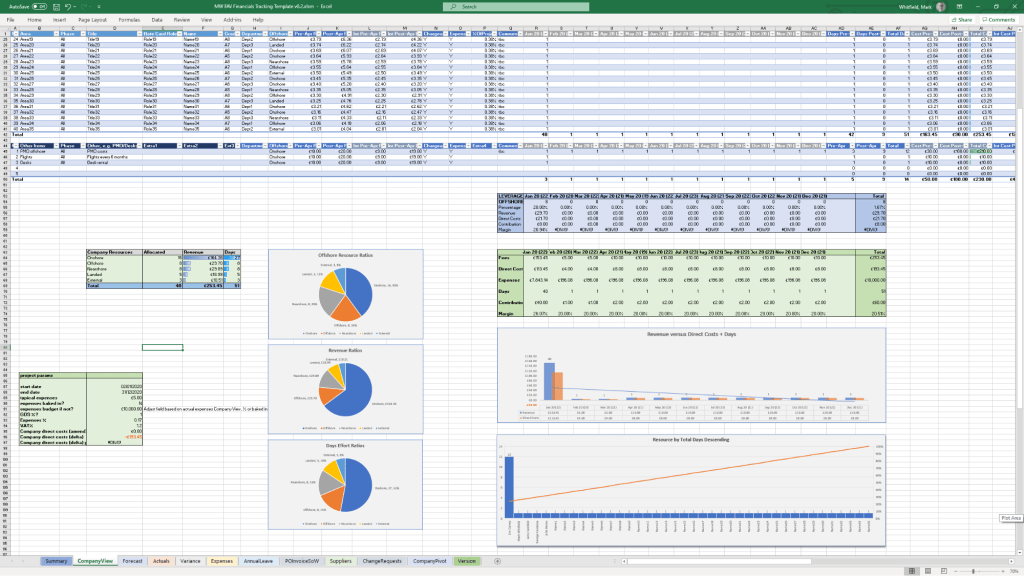
Project Financial Tracker
MS Tool: MS Excel
Description: A financial controller mapping internal and external forecast costs against actuals, factoring in margins, variances, supplier fees, and expense categories.
Resource, Sickness, & Leave Tracker
MS Tool: MS Excel
Description: An operational matrix monitoring annual leave, sickness, and training schedules to adjust resource availability and capacity within the master schedule.
1. Financial & Resource Management MS Excel Templates
4. Agile Delivery Metrics
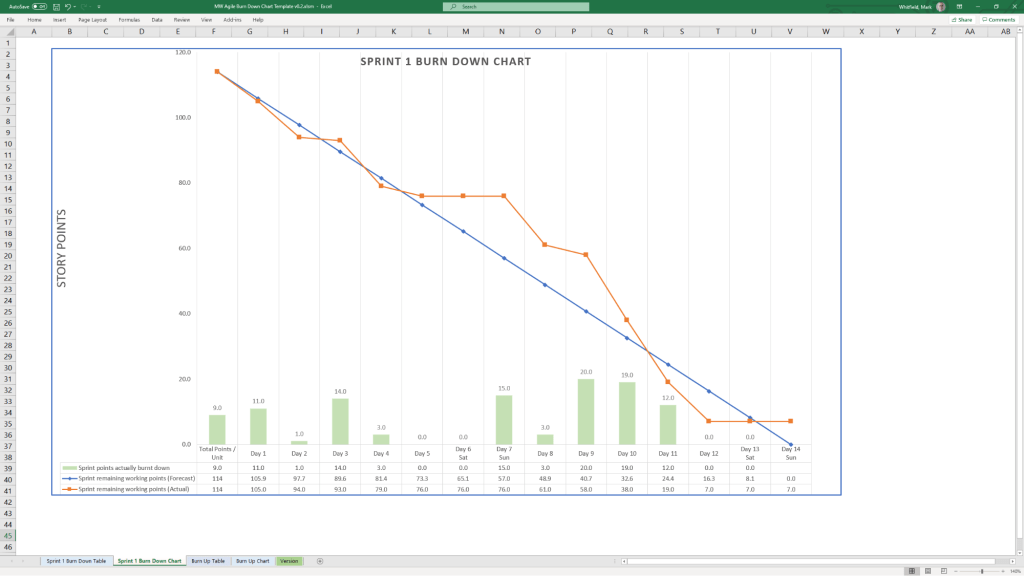
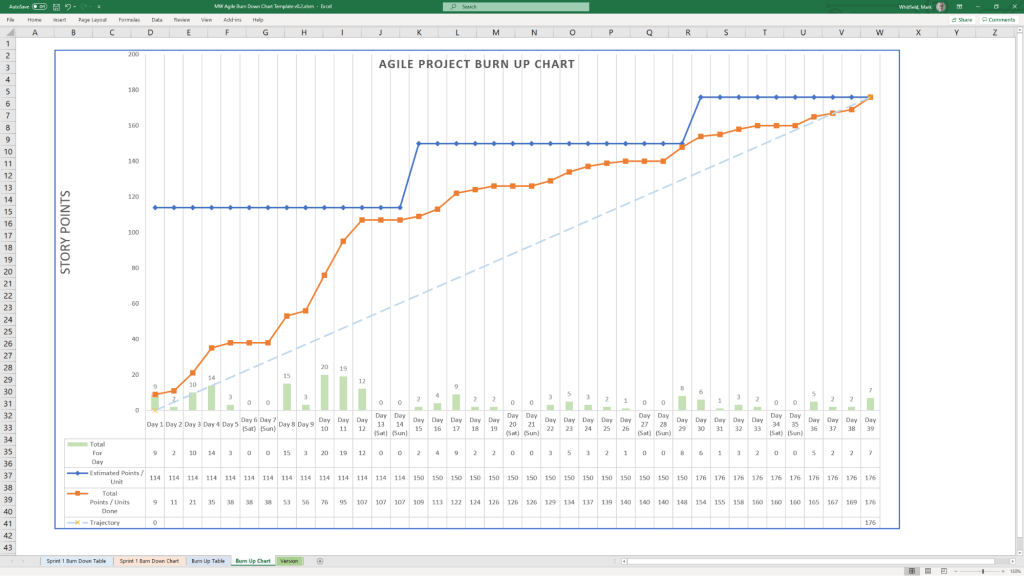
Agile Burn Down & Burn Up Charts
MS Tool: MS Excel
Description: Manual data-table tracking solutions designed to visualise sprint or release velocity for teams operating without access to enterprise tools like Jira.
1. Agile Burn Down Chart in MS Excel Template Example2. Agile Burn Up Chart in MS Excel Template Example
5. Communications & Administration
PRINCE2 Management Products
MS Tool: MS Word (.doc)
Description: A full portfolio of standard documentation masters including Project Initiation Documents (PID), Project Briefs, Highlight Reports, and Business Cases.
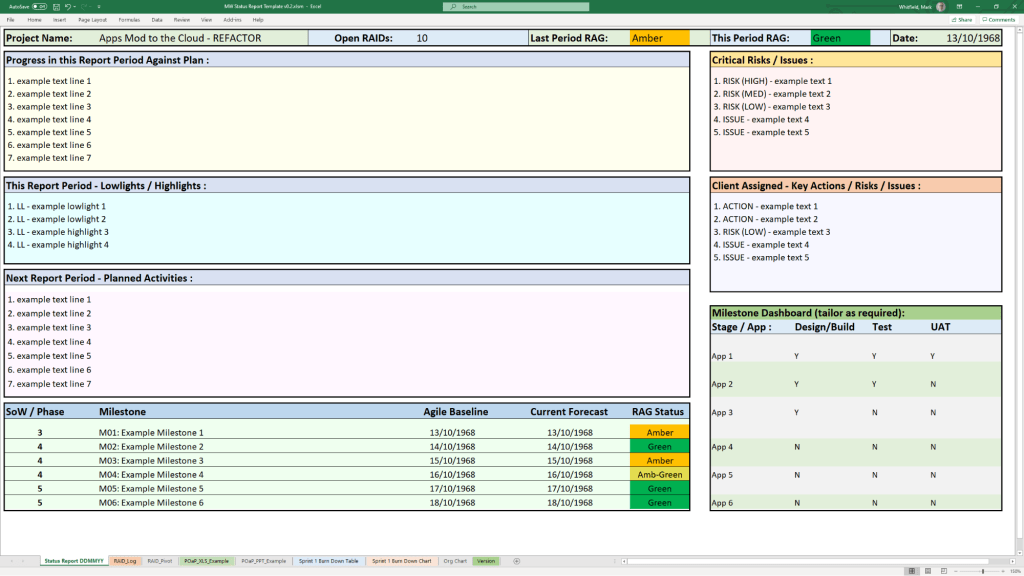
Project Status Report
MS Tool: MS Word & MS PowerPoint
Description: Weekly and monthly progress reporting templates featuring structured sections for milestones, blockers, financial status, and RAG indicators.
Kick-Off Deck & Mobilisation Kit
MS Tool: MS PowerPoint
Description: Onboarding and alignment slide decks designed to define scope, establish ground rules, and guide teams through project initiation.
Meeting Minutes Template
MS Tool: MS Word
Description: An action-oriented meeting layout tailored for capturing critical decisions, owners, and deadlines uniformly.
1. Communications & Administration MS Excel Status Report Template Example
The best approach to writing a project plan breakdown is to use a top-down decomposition strategy centered on a Work Breakdown Structure (WBS). This technique methodically slices a complex, high-level project into smaller, manageable chunks called work packages, ensuring that nothing is missed.
To build a flawless, actionable project breakdown, you must establish the project’s foundation before dissecting it into individual tasks.
1. Define the Scope and Deliverables
Before diving into a micro-level breakdown, you must know what you are building—and what you are not building.
Write a scope statement: Document the final outcomes, project boundaries, and explicit exclusions to prevent scope creep.
Identify major deliverables: Determine the high-level milestones or chunks of tangible value that must be completed.
Apply the 100% rule: The Project Management Institute (PMI) notes that your WBS must include 100% of the internal, external, and interim project management work.
2. Structure the Levels of Decomposition
A good project plan breakdown uses hierarchical tiers. Do not mix daily tasks with macro phases. Instead, follow a logical breakdown hierarchy:
Level 1 (The Project): The overall project objective or final product.
Level 2 (Phases or Major Deliverables): Broad operational segments (e.g., Initiation, Design, Development, Testing).
Level 3 (Sub-deliverables): Specific components within a phase (e.g., under Development, you might have Frontend Architecture).
Level 4 (Work Packages): The lowest level of the WBS. These are discrete items that can be assigned to a specific team or individual and estimated for time and budget.
3. Apply the 80-Hour Rule
When decomposing down to the task level, determine how granular you need to be by tracking effort, not just calendar time:
The 80-hour threshold: A single work package should take no more than 80 hours (two weeks of full-time work) and no less than 8 hours to complete.
Avoid micro-management: If a task takes less than 8 hours, group it with others. If it exceeds 80 hours, it is too complex and needs to be broken down further.
4. Build a WBS Dictionary
A visual chart or list is helpful, but context prevents mistakes. For each work package at the bottom of your hierarchy, document:
Task description: Clear language outlining what “done” actually looks like.
Assigned owner: One single person or team responsible for the execution.
Pre-requisites and dependencies: Clarify which tasks must finish before the next can begin.
5. Sequence, Estimate, and Schedule
Once the work is broken down, pull it into a working chronological timeline using software like Microsoft Project (see MS .mpp templates in website banner), Asana or Monday.com.
Sequence activities: Map the chronological order and identify the critical path—the longest string of dependent tasks.
Estimate duration & resources: Gather the actual people doing the work to estimate time, capacity, and material needs realistically.
Add contingency: Factor in safety buffers to protect the project baseline from unexpected delays.
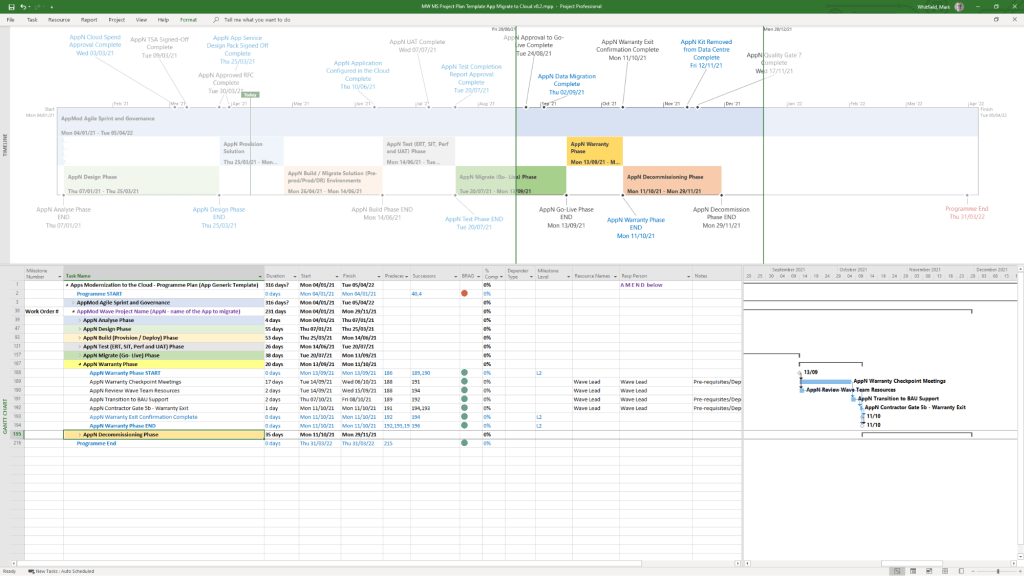
Microsoft Project is a powerful project management software used to plan, schedule, and oversee tasks, resources, and deadlines. Its native .mpp file format supports building Work Breakdown Structures (WBS), calculating critical paths, allocating resources, and monitoring project budgets within the Microsoft ecosystem.
Configuring a high-quality .mpp plan requires a systematic approach to ensure schedule accuracy and prevent logic errors. Follow this step-by-step methodology to build a robust plan:
1. Project Initialization
Set Project Information: Go to the Project tab, click Project Information, and define your Start Date. Ensure the scheduling is set to start from this date rather than a “Current Date” override.
Define Working Calendars: Adjust your project’s default calendar for weekends, statutory holidays, and company non-working time so the timeline accurately reflects actual working days.
Configure Default Scheduling: Go to File > Options > Schedule and set New tasks created to Auto Schedule. This ensures your tasks respond automatically to changes in predecessors and durations.
2. Work Breakdown Structure (WBS)
Brainstorm Task Lists: Before entering dates, list all project deliverables and normal tasks in the Gantt Chart view.
Apply Hierarchy: Use the Indent/Outdent features to organize tasks into major phases (Summary Tasks) and actionable subtasks (Work Packages).
Create Milestones: Set the duration of key deliverable completions or approval gates to 0 days to act as clear checkpoints on your timeline.
3. Task Dependencies & Logic
Establish Relationships: Link tasks in logical sequences (e.g., using Finish-to-Start relationships). Every task—except the very first one in the project—must have a predecessor.
Never Link Summary Tasks: Only link the lowest-level subtasks. Linking summary task bars introduces circular logic errors and unpredictability.
Avoid Hard Constraints: Do not type specific dates into the Start/Finish columns unless absolutely mandatory. Doing so creates “Must Start On” constraints that break the critical path when upstream tasks are delayed.
4. Resource Allocation
Setup the Resource Sheet: Navigate to the Resource Sheet and add all resources required to do the work, defining their standard rates, maximum capacities (e.g., 100% availability), and calendars.
Assign Resources: Return to the Gantt Chart and assign specific work resources (people) to corresponding tasks. This helps Microsoft Project calculate total effort and spot resource overallocations.
Resource Leveling: Use the built-in Resource Leveling feature to automatically adjust assignments and resolve conflicts when team members are overcommitted.
5. Finalizing and Tracking
Set a Baseline: Once the plan has been reviewed and approved by stakeholders, go to Project > Set Baseline. This captures a snapshot of your original scope, Start, Finish, Cost, and Work fields.
Set the Status Date: When recording progress, always set the Status Date to today’s date before entering percentage completions.
Project risks are uncertain events that, if they occur, can impact a project’s objectives. They are generally broken down into core categories: financial, technical, schedule, operational, and external. Proper risk assessment evaluates the probability and impact of these threats to prioritize mitigation strategies.
Detailed Risk Breakdown
1. Financial Risks
These risks relate to project budgets, funding cuts, and cash flow.
Cost Overruns: Expenses exceeding the allocated budget.
Funding Delays: Cash flow interruptions from sponsors or clients.
Currency Fluctuations: Affecting purchasing power for international materials.
Severity:High/Critical. Can lead to project cancellation if not mitigated.
2. Technical Risks
Emerging from technology gaps, security vulnerabilities, or poor integration.
Technology Failures: Systems crashing or underperforming.
Software Bugs: Errors causing glitches or data corruption.
Security Breaches: Data theft or loss compromising privacy.
Severity:Medium to High. Can completely stall deliverables or undermine final quality.
3. Operational Risks
Internal workflow inefficiencies, process breakdowns, and human factors.
Resource Shortages: Missing key team members or materials.
Poor Communication: Siloed workflows leading to rework and mistakes.
Supply Chain Disruptions: Delays in procuring high-quality goods.
Severity:Low to Medium. Tends to erode timelines quietly but can escalate if left unmanaged.
4. Schedule Risks
Risks jeopardizing deadlines, causing timeline slippage or severe delays.
Scope Creep: Uncontrolled changes or continuous addition of project requirements.
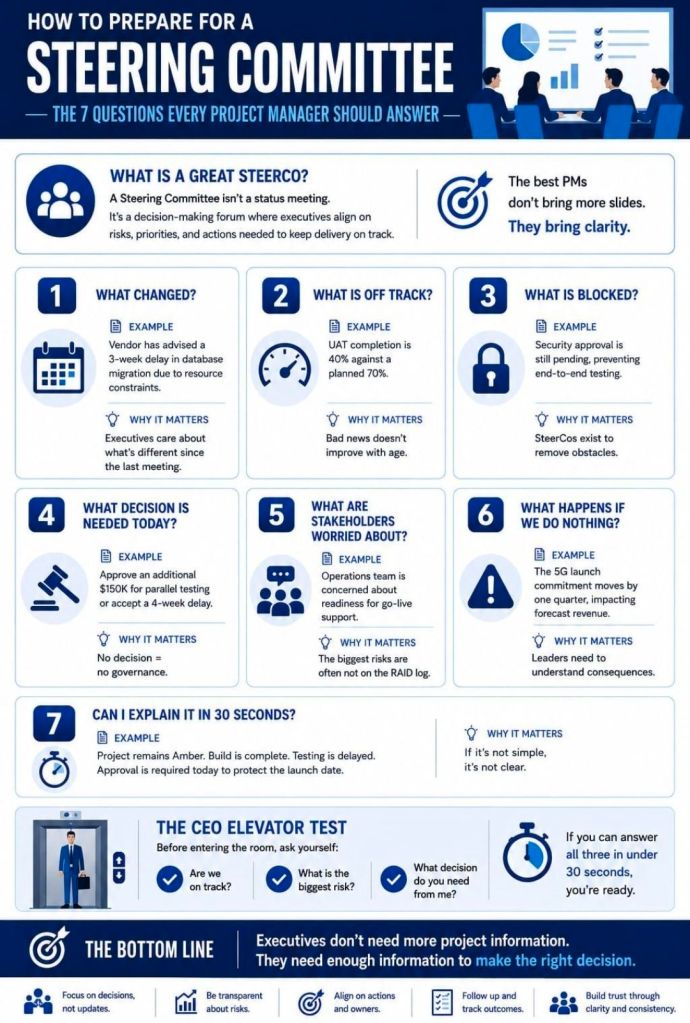
1. Preparing for a Steering Committee, SteerCo2. Preparing for a Steering Committee, SteerCo
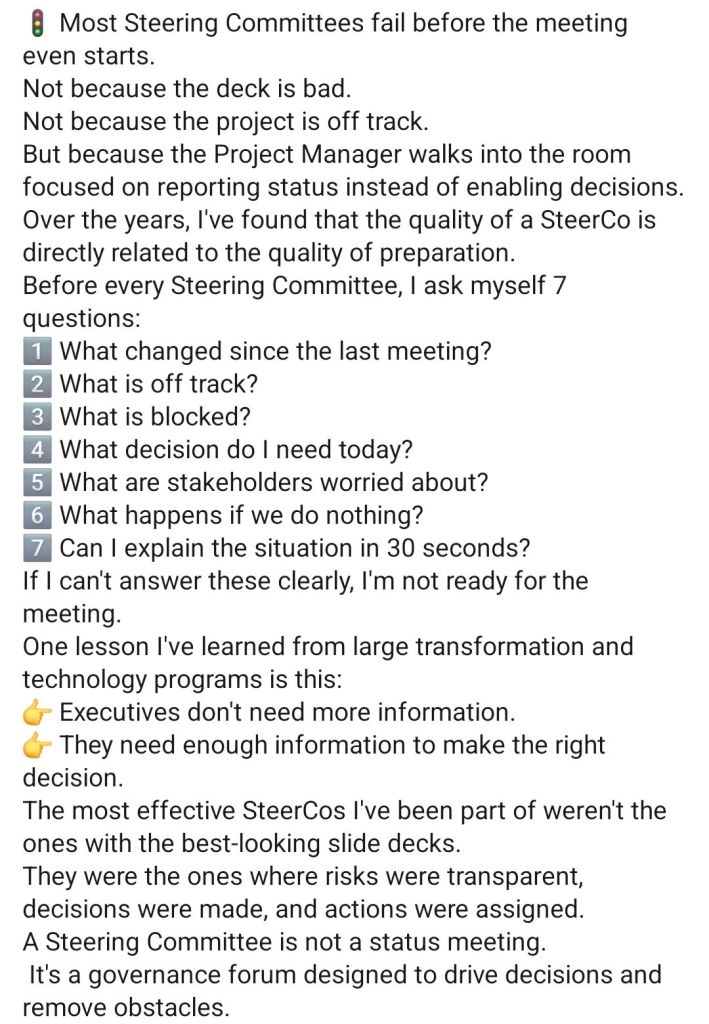
Also,
Preparing for a Steering Committee (SteerCo) means ensuring senior stakeholders are aligned, not surprised.
Share a concise pre-read 48–72 hours prior focusing on strategic updates, key risks, and necessary decisions. Use the meeting itself to seek guidance or arbitration rather than just reading through slides.
A successful SteerCo relies on keeping your presentation highly strategic. Here is an actionable checklist to prepare:
1. The Pre-Read (Distribute 2-3 Days Before)
One-Page Status Summary: A simple Red-Amber-Green (RAG) dashboard covering schedule, budget, and scope.
The “Ask”: Clearly outline the specific decisions or approvals you need from the committee.
No Surprises Rule: If there is a major blocker or budget overrun, brief key members individually before sending the formal pack.
2. The Presentation Structure
Executive Summary: Quick reminder of project goals, scope, and target timelines.
Project Progress: Highlight major milestones recently achieved.
Financial Health: Compare actual spend vs. planned budget.
Risks & Issues: Focus only on severe roadblocks and present actionable mitigation options.
Decisions Needed: State the options, pros/cons, and your recommendation.
3. During the Meeting
Focus on the Big Picture: Do not get bogged down in granular project details.
Manage the Politics: Be prepared for pushback and answer objectively. If you don’t know an answer, take an action item rather than bluffing.
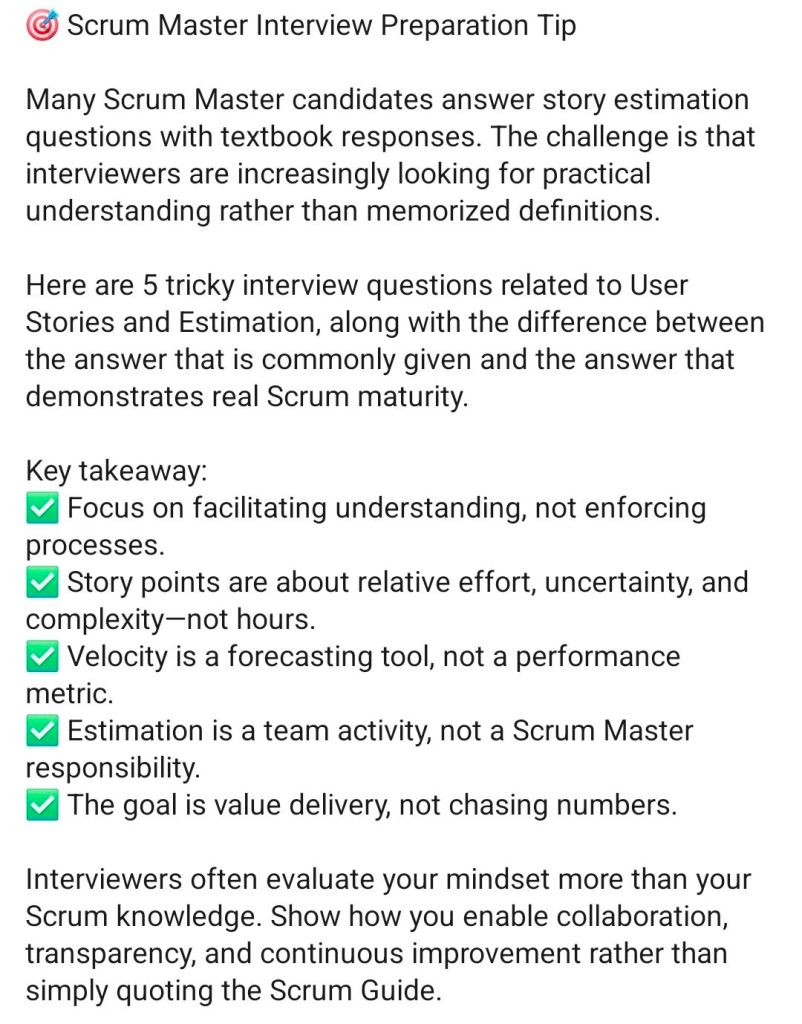
Typical Agile Scrum Master interview questions evaluate your understanding of the Scrum Framework (the 3-5-3 structure), your ability to facilitate continuous improvement, and your soft skills in conflict resolution and servant leadership.
The questions generally fall into four core categories:
1. Scrum Fundamentals & Frameworks
These questions test your technical knowledge of Scrum and how it compares to other frameworks.
Explain Scrum vs. Agile: Agile is the overarching mindset and set of principles; Scrum is a specific, lightweight framework for implementing Agile.
The 3-5-3 structure: What are the three roles (Product Owner, Scrum Master, Developers), five events (Sprint, Sprint Planning, Daily Scrum, Sprint Review, Sprint Retrospective), and three artifacts (Product Backlog, Sprint Backlog, Increment)?
Scaling Agile: What experience do you have scaling Agile (e.g., SAFe, Scrum of Scrums, Nexus) if the organization is large?
2. Facilitation & Coaching
Interviewers want to see how you run events, coach Product Owners, and improve team delivery.
Daily Scrum: What is your approach to running the Daily Scrum, and how do you prevent it from becoming just a status update?
Retrospectives: What specific techniques or games do you use to keep retrospectives fresh and actionable?
Definition of Done (DoD): How do you help a team create and adhere to a clear Definition of Done?
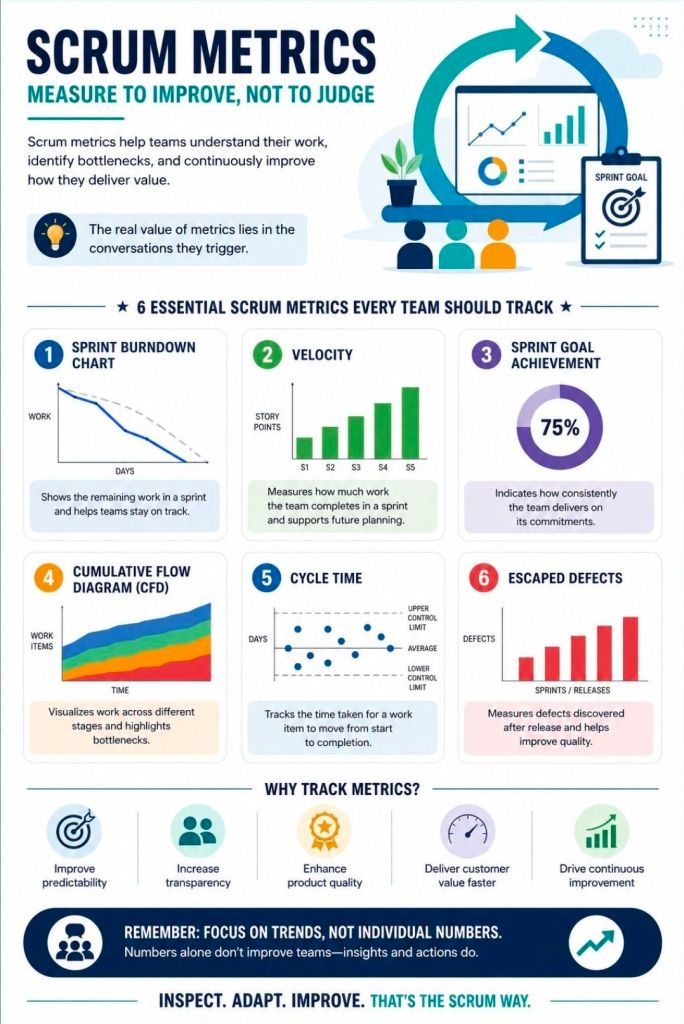
Metrics: How do you track a team’s effectiveness (e.g., velocity, sprint goal success, cycle time, burndown charts)?
3. Behavioral & Situational Scenarios
These “tell me about a time when…” questions assess your real-world experience.
Team Conflict: Can you describe a time when you had to resolve a conflict between team members or between a developer and the Product Owner?
Resistant Teams: What would you do if a team member or stakeholder doesn’t see the value in Scrum ceremonies and refuses to participate?
Management Intervention: How do you handle managers or executives who try to bypass the Scrum process or assign work directly to the developers?
Scope Creep: How do you handle sudden mid-sprint requirement changes or scope creep?
4. Self-Awareness & Servant Leadership
Hiring managers ask these to test your humility and growth mindset.
Your Greatest Failure: Can you share a time you failed as a Scrum Master, and what you learned from the experience?
Protecting the Team: How do you say “no” to leadership or protect the team from external noise while still serving the broader organization?
__________
More Agile Scrum Questions with Example Answers:
Mastering a Scrum Master interview involves demonstrating a deep understanding of servant leadership, the Agile mindset, and hands-on experience navigating team dynamics. Below are the most common interview questions, summarized with strategic, industry-recommended answers to help you stand out.
Core Scrum Framework & Mechanics
Question 1: Explain the 3-5-3 structure of Scrum.
What they’re looking for: A solid foundation in Scrum basics.
Recommended Answer: “Scrum is governed by a ‘3-5-3’ rule: 3 roles (Product Owner, Scrum Master, Developers), 5 events (Sprint, Sprint Planning, Daily Scrum, Sprint Review, Sprint Retrospective), and 3 artifacts (Product Backlog, Sprint Backlog, Increment).”
Question 2: What is the difference between a Product Backlog and a Sprint Backlog?
What they’re looking for: Understanding of backlog management and scope.
Recommended Answer: “The Product Backlog is a continuously evolving, prioritized list of everything needed for the product, owned by the Product Owner. The Sprint Backlog is a subset of the Product Backlog—it’s the specific forecast of items the team commits to delivering during the current sprint.”
Behavioral & Situational Questions
Question 3: How do you handle conflict within the Scrum team?
What they’re looking for: Your facilitation and conflict-resolution skills, avoiding direct intervention where the team can self-manage.
Recommended Answer: “I avoid playing the role of a micromanager. Instead, I facilitate open dialogue and encourage the team to address the conflict directly using the Scrum values of openness and respect. My goal is to guide them to find a mutually agreeable solution while fostering an environment of psychological safety.”
Question 4: What do you do if a team member refuses to adopt Scrum practices?
What they’re looking for: Change management skills and patience.
Recommended Answer: “I first try to understand the root cause of their resistance, as it usually stems from a lack of understanding or fear of change. I would have a private one-on-one conversation to address their concerns. I might pair them with an experienced Agile advocate or use team-building exercises to demonstrate the value of Scrum in a low-pressure way.”
Leadership & Stakeholder Management
Question 5: Tell me about a time you had to challenge leadership or management.
What they’re looking for: The courage to protect the team’s focus and uphold Scrum principles.
Recommended Answer: “I once had a stakeholder attempt to bypass the Product Owner and directly assign high-priority tasks to Developers mid-sprint. I respectfully but firmly challenged this by explaining how breaking the Sprint Goal jeopardizes the team’s focus and the project’s overall velocity. I then helped the stakeholder work with the Product Owner to place the new task in the Product Backlog for the next sprint planning.”
Question 6: How do you measure if your team is truly Agile?
What they’re looking for: Focus on delivering value over measuring arbitrary metrics like velocity.
Recommended Answer: “Velocity is for planning, not for measuring success. I look at outcome-based metrics, such as Sprint Goal success rates, customer satisfaction scores, time-to-market, and the quality of increments. The ultimate measure is whether we are continuously delivering iterative business value to our end users.”
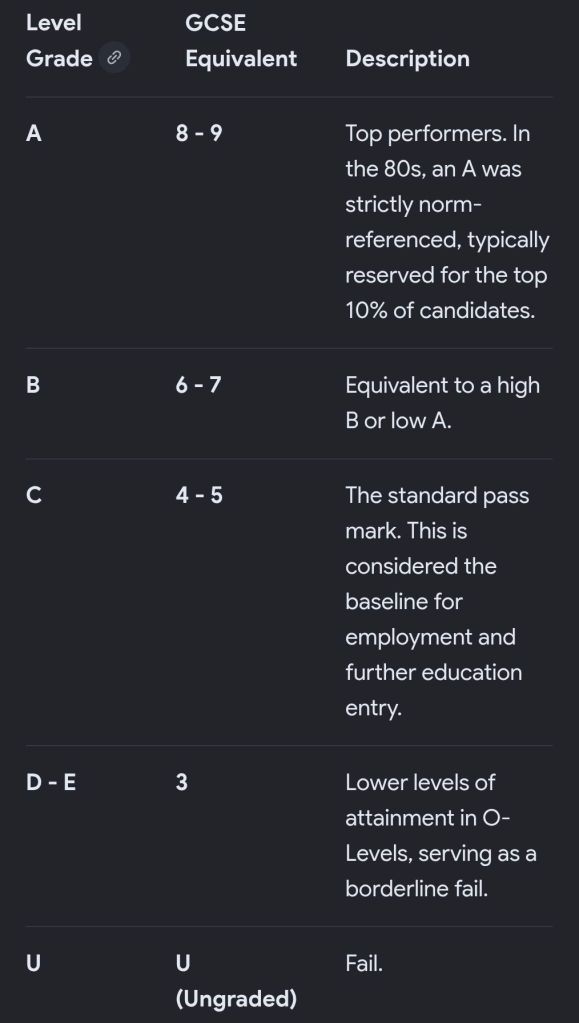
In the 1980s, GCE O-Level grades ranged from A to E (where A, B, and C were considered passing). Due to grade inflation and changes in the curriculum over the decades, an O-Level grade C is roughly equivalent to a Grade 4 in the current numerical GCSE system, while an O-Level grade A equates to a Grade 7 or 8.
A direct, point-by-point comparison between the O-Level system of the 1980s and today’s numerical GCSE grades reveals the following equivalence:
O-Level grade C is equivalent to Grade 4, while O-Level grade A equates to Grade 7/8
Important Differences in System Design
Grading Method: O-Levels were norm-referenced, meaning a fixed percentage of students received each grade every year, regardless of the overall score. Today’s GCSEs are criterion-referenced, meaning grades are awarded based strictly on the skills and knowledge the student demonstrates, with grade boundaries adjusted accordingly.
Cohort Reach: In the 1980s, O-Levels were designed for the top 20–25% of the academic cohort, while the next 40% took CSE (Certificate of Secondary Education) exams. The modern GCSE is designed to cater to the vast majority of all abilities.
Assessment & Breadth: O-Levels were almost entirely dependent on final, high-stakes written exams, whereas modern GCSEs require more breadth across a wider range of subjects and rely heavily on 9-1 scoring.
Direct comparison between O-Level system of 1980s and today’s numerical GCSE grades
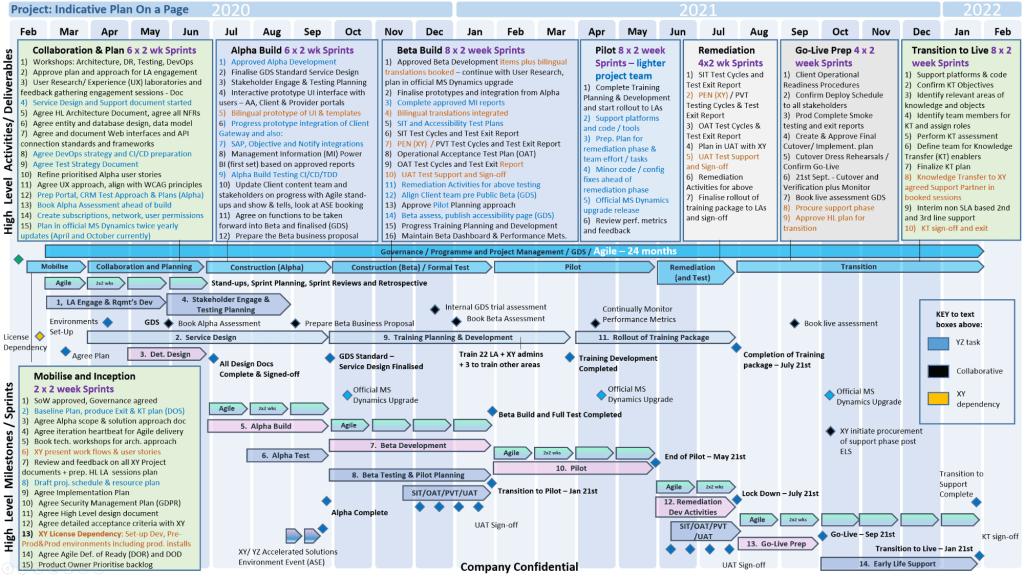
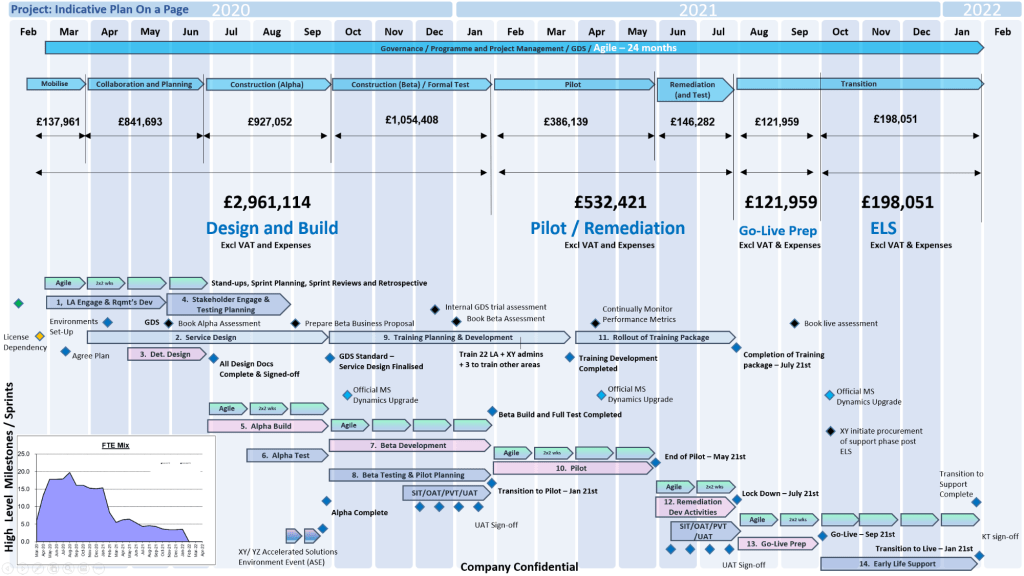
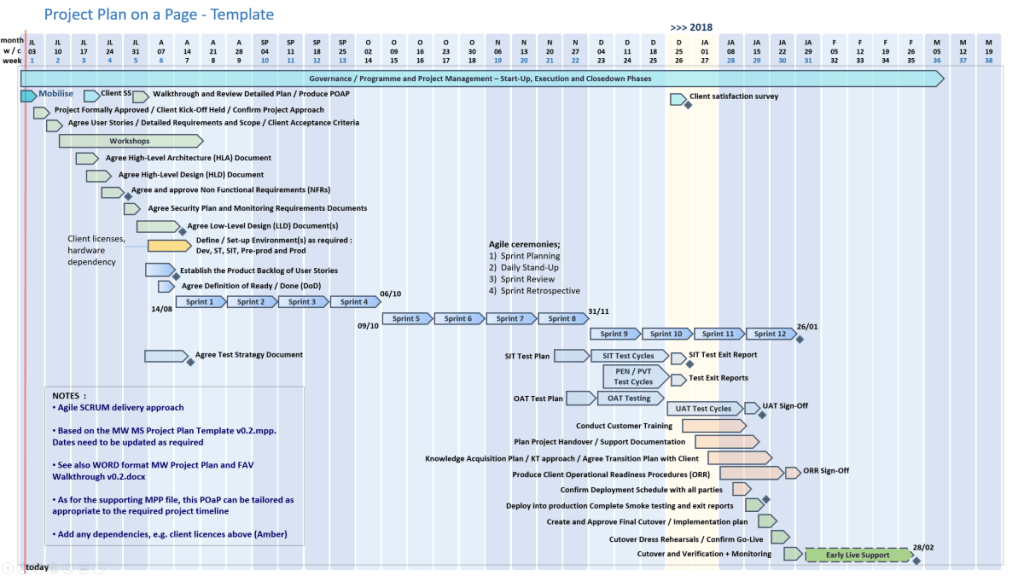
A Plan on a Page (POAP) is a concise, visual summary of a project’s core elements. It distills complex, granular project details into a highly accessible, single-page format.
It acts as an executive summary rather than a replacement for comprehensive, detailed project plans. Example, tailorable Agile and Waterfall MS PowerPoint POaP project templates can be purchased at this link.
Plan On a Page also known as a POAP
🎯 Primary Purpose
Executive Communication: Provides busy stakeholders and C-level management with rapid visibility into a project’s status without overwhelming them with data.
Alignment: Ensures teams, sponsors, and stakeholders share a unified understanding of project goals and direction.
Focus & Risk Management: Keeps the strategic vision front-and-center, prevents teams from getting “lost in the weeds,” and allows leaders to spot high-level risks early.
Decision Support: Serves as a quick reference guide during steering committee and status meetings.
A Plan on a Page (POAP) is a concise, visual summary of a project’s core elements
📝 Content Summary
To fit on a single page, a POAP strips away tactical daily tasks and focuses only on the most critical strategic and timeline components:
Project Vision & Scope: A concise statement of what the project aims to deliver.
Objectives & KPIs: Specific, measurable targets and Key Performance Indicators to measure success.
Visual Timeline: A high-level roadmap, Gantt chart, or phase-based breakdown (e.g., Discovery, Execution, Launch) displaying major milestones.
Project Health/Status: Current RAG (Red/Amber/Green) status or progress tracking.
Resource & Budget Allocation: High-level overview of assigned budget and key personnel.
Risk & Dependencies: Notable blockers, constraints, or critical assumptions.
Governance & Contacts: The project sponsors, managers, and the best way to get support.
All POAP templates can be purchased by clicking on the link on the website banner
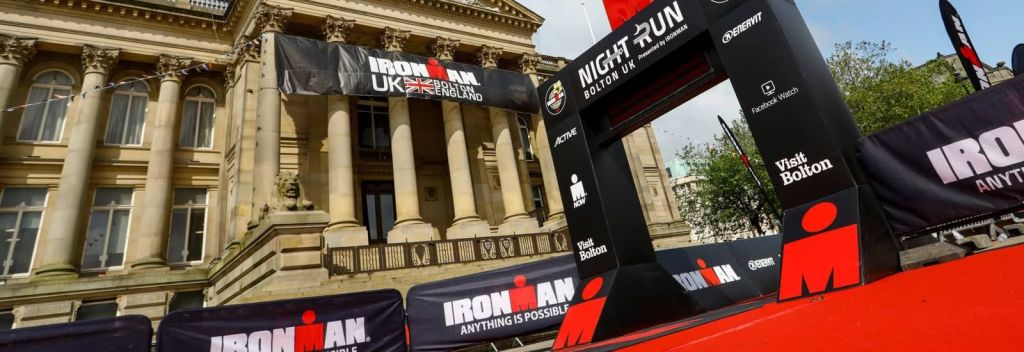
The IRONMAN 70.3 Bolton is the UK’s standout early-summer middle-distance triathlon, featuring a 1.2-mile lake swim, a 56-mile hilly bike ride, and a 13.1-mile town center run. The event has a legendary electric finish in the heart of Bolton on Victoria Square.
2026 IRONMAN 70.3 Bolton
Event Profile
Date: Sunday, June 7
Format: Age-group and professional categories, featuring a self-seeded rolling swim start.
Energy Partner:Maurten Gels are available on-course for athlete fueling.
Bike (56 Miles / 90 km): A two-loop circuit around the surrounding regions before heading north into the Lancashire Moors. It is known to be a challenging, undulating ride with some technical sections.
Run (13.1 Miles / 21.1 km): A mostly flat, two-loop half marathon through Queens Park and the historic streets of Bolton.
Spectator Information & Logistics
Finish Line: The final stretch leads competitors down the Red Carpet toward the steps of the Bolton Town Hall.
Road Closures: Extensive road closures and bus diversions affect the area, with major impacts on roads and surrounding routes.
Local Amenities: Spectators and athletes have access to local hubs like the Albert Halls Bolton and the Bolton Museum, both located right near Victoria Square.
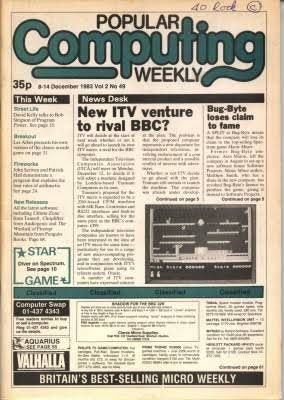
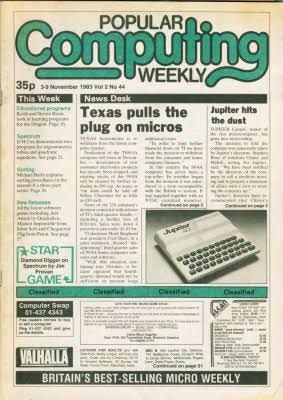
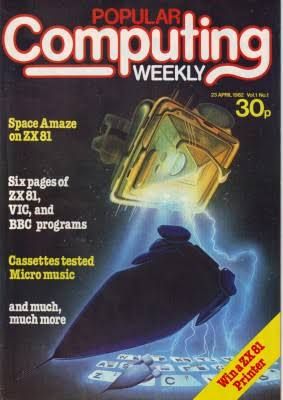
Popular Computing Weekly (frequently abbreviated as PCW) was a highly influential British computer magazine published from 23 April 1982 to 14 June 1990.
Popular Computing Weekly British Computer Magazine from 1982 thru 1990
Launched by Sunshine Publications and led by founding editor Duncan Scot, it stood out by providing rapid-fire weekly news, hardware reviews, type-in software programs, and gaming coverage at the height of the UK’s home microcomputer boom.
Over its eight-year lifespan, it produced 415 issues, adapting its identity from a broad hobbyist guide to a gaming-centric publication before closing in the early 1990s.
Magazine Overview & Core Elements
Unlike glossy monthly publications such as Personal Computer World or Your Computer, Popular Computing Weekly acted as a fast-paced “newspaper” for the UK micro community. Because it hit newsagent shelves every seven days, it could report on dramatic price drops, industry buyouts, and hardware delays weeks before monthly rivals.
The magazine catered to a wide array of early systems, including the ZX Spectrum, Commodore 64, BBC Micro, Amstrad CPC, Atari 8-bit, Dragon 32, VIC-20, and later the 16-bit machines. Its format generally consisted of:
News Desk: Urgent industry reporting, micro-market trade wars, and launch delays.
Hardware and Software Reviews: Critical evaluations of new home computers and software titles.
Type-In Listings: Pages of raw BASIC or Machine Code that readers meticulously copied into their systems to run games and utilities.
Gaming Coverage & Puzzles: Dedicated spaces for arcade game high scores, maps, and adventure hints.
Detailed Timeline Breakdown (1982–1985)
1982: Launch and the 8-Bit Explosion
April: On 23 April 1982, Issue 1 was published by London-based Sunshine Publications. The launch editor, Duncan Scot, managed the first 8 issues before handing the reins over to Brendon Gore.
May–June: The magazine’s debut directly coincided with Sir Clive Sinclair’s unveiling of the ZX Spectrum. Popular Computing Weekly quickly positioned itself as a critical hub for Spectrum and BBC Micro setup guides and technical support.
System Agnosticism: Early volumes accommodated a highly fractured market, including type-in listings for the ZX81, VIC-20, Acorn Atom, TRS-80, and early Apple II systems.
Cover Price: The early issues cost just 30p.
1983: Price Wars and Rising Circulation
The Boom Year: Home computing exploded in the UK. PCW capitalised on its fast turnaround to report on brutal, ongoing price slashes initiated by Commodore, Sinclair, and Atari.
Market Diversification: Content expanded heavily to track new contenders like the Oric-1, Dragon 32, and the newly launched Commodore 64.
Commercialisation: Software companies grew rapidly. Advertising pages surged with multi-page spreads from early publishing giants like Imagine Software, Ocean Software, and Ultimate Play The Game.
1984: Amstrad’s Arrival and Market Shocks
April: The magazine closely documented Alan Sugar’s entry into the computer market with the Amstrad CPC 464, which changed the landscape by packaging a computer, keyboard, and monitor into an all-in-one unit.
The Crash Warning: PCW reported extensively on the high-profile financial collapse of Imagine Software and structural corrections across the British software industry.
The MSX Standard: The magazine devoted substantial print space to tracking the arrival of Japanese MSX standard computers (such as Toshiba’s HX-10) attempting to break into the UK.
1985: Transition to 16-Bit and Gaming Domination
January: The magazine followed the rocky release of the business-oriented Sinclair QL and the debut of the dual-mode Commodore 128.
May: The news desk shifted focus to the 16-bit horizon, tracking early announcements for the Atari 520ST and Commodore Amiga.
Pricing: Driven by inflation and increased page counts, the cover price rose to 40p.
Software Pivot: As users grew tired of typing in complex code by hand, the publication reduced its raw code listings and pivoted towards dedicated, full-colour video game previews, software reviews, and maps.
Post-Early Eighties Legacy (1986–1990)
Beyond its golden era, the publication continued to evolve through the late 1980s. By 1989, regular home micro content declined as the industry consolidated around IBM-compatible PCs, the Amiga, and the Atari ST. To compensate for falling sales, PCW incorporated Computer Gamesweek in 1989, morphing almost entirely into a video games magazine.
1. Popular Computing Weekly British Computer Magazine from 1982 thru 1990
2. Popular Computing Weekly British Computer Magazine
Sunshine Publications eventually closed the magazine on 14 June 1990 with its 415th issue, ending its run as a primary historical record of the 1980s British microcomputing phenomenon.
Catherine Schell is an internationally acclaimed Hungarian-born British actress celebrated for her commanding presence and versatility across mainstream cinema, comedy, and British cult television.
Catherine Schell
Best known for her iconic roles as the shape-shifting alien Maya in Space: 1999, the glamorous Lady Claudine Litton in The Return of the Pink Panther, and a Bond girl in On Her Majesty’s Secret Service, she seamlessly navigated international franchises, sci-fi cult classics, and intense television dramas.
Multilingual Fluency: English, German, Hungarian, French
Dramatic & Comedic Range: Specialized in high-society characters, physical/slapstick comedy, and genre science fiction.
Formal Training: Otto Falckenberg School of the Performing Arts (Munich), complemented by intensive private dramatic coaching.
Key Achievements
Cult Sci-Fi Status: Immortalized the premier character “Maya” in Season 2 of Space: 1999, requiring extensive prosthetic makeup and creating a global fanbase.
Box Office Success: Featured as the primary female lead opposite Peter Sellers in the smash-hit comedy The Return of the Pink Panther (1975).
Literary Author: Documented her life in two critically praised autobiographies: A Constant Alien (2016) and When God Was Out For Lunch (2018).
Catherine Schell as the shape-shifting alien Maya in Space: 1999
Comprehensive Chronological Timeline
1944–1957: Early Life and Displacement
1944: Born in Budapest during an allied bombing raid to Baron Paul Schell von Bauschlott (a diplomat) and Countess Katharina Maria Etelka Georgina Elisabeth Teleki de Szék.
1945–1948: Experienced post-war Russian occupation and absolute poverty after the Nazi and Communist regimes confiscated her family’s ancestral estates.
1948: Escaped Hungary with her family, living as refugees in Vienna and Salzburg, Austria.
1950: Emigrated to the United States. Her father renounced his noble title to secure American citizenship. Catherine entered a strict Catholic convent school on Staten Island, New York.
1956: Her mother became a cause célèbre and was imprisoned for actively protesting the Soviet invasion of Hungary.
1957–1967: Training and European Screen Debut
1957: Relocated to Munich, Germany, where her father joined Radio Free Europe. She attended the American School and fell in love with acting.
1961–1963: Entered Munich’s prestigious Otto Falckenberg School but pivoted to private lessons to rapidly master theatrical German.
1964: Made her professional feature film debut under the name “Catherine von Schell” in the German adventure film Lana, Queen of the Amazons, followed by the crime mystery Traitor’s Gate (Das Verrätertor).
1967: Starred in the Euro-drama film Hell Is Empty.
1968–1974: Rise in British Cinema & Franchise Success
1968: Co-starred in The Amsterdam Affair, where she met her first husband, British actor William Marlowe. She permanently relocated to London.
1969: Achieved massive international visibility through two high-profile Hammer/Eon productions:
Cast as Nancy, one of Blofeld’s “Angels of Death,” in the James Bond classic On Her Majesty’s Secret Service.
Starred as Clementine in Hammer Film’s sci-fi adventure Moon Zero Two.
1971: Guest-starred in the landmark British action-comedy series The Persuaders! (episode: “The Gold Napoleon”).
1972: Appeared alongside Bette Davis in the film Madame Sin and took a regular television role as Diane Marsh in The Adventurer.
1974: Co-starred with Michael Caine in the political thriller The Black Windmill and took the role of Jenny in the cinematic adaptation of Callan.
1975–1979: The “Golden Era” (Pink Panther & Space: 1999)
1975: Reached peak mainstream cinematic fame as Lady Claudine Litton in The Return of the Pink Panther. Her genuine struggle to suppress laughter at Peter Sellers’ improvisations was deliberately left in the final cut by director Blake Edwards.
1975: Portrayed the “Servant of the Guardian” in the Season 1 episode of Space: 1999 titled “Guardian of Piri”.
1976–1977: Hired by producer Fred Freiberger to inject new energy into Season 2 of Space: 1999. She played Maya, a brilliant, shape-shifting alien from the planet Psychon. The role required hours of daily cosmetic transformations and solidified her legacy as a sci-fi icon.
1977: Divorced William Marlowe. Met TV director Bill Hays while filming the series Looking for Clancy. She also starred in the fantasy film Gulliver’s Travels.
1979: Delivered two more definitive genre performances:
Played Countess Heidi Scarlioni opposite Tom Baker’s Fourth Doctor in the legendary Doctor Who serial “City of Death”.
Re-teamed with Peter Sellers in the comedy feature The Prisoner of Zenda.
1980–1996: Mature Dramatic Roles and Later Career
1980–1981: Appeared in episodic television such as The Gentle Touch, The Spoils of War, and The Island of Adventure.
1982: Married director Bill Hays.
1983–1985: Balanced prominent theatre and television work, including guest roles on Bergerac and a prestigious TV production of A Month in the Country (1985).
1988: Played Lotte Zons in the critically acclaimed cinematic period drama On the Black Hill.
1989: Guest-starred in highly rated British soaps and procedurals, including The Bill and Howards’ Way.
1990: Starred as Virginia Mitchell (aka Dominique) in the popular WWII French Resistance TV drama Wish Me Luck.
1991–1994: Appeared in Lovejoy (1991), Piccolo grande amore (1993), and the TV mini-series The Wimbledon Poisoner (1994).
1996: Officially stepped back from full-time acting after appearing as Inspector Helene Masson in the crime drama series The Knock.
1997–2019: Retirement and Hospitality in France
1997–2005: Relocated to the historic village of Bonneval in France. She successfully owned and operated a small, highly regarded boutique guest hotel/Chambre d’Hôtes.
2006: Suffered the tragic loss of her husband, Bill Hays, who passed away in March. Subsequently retired from running the guest house.
2016: Published her first critically well-received autobiography, A Constant Alien (Fantom Publishing).
2018: Released her second volume of memoirs, When God Was Out For Lunch.
2020–Present: Selective Return to the Screen
2020: Made a grand return to television under the direction of Damon Thomas, portraying Duchess Valeria in the critically praised BBC/Netflix horror mini-series Dracula.
2022: Cast by director Rob Zombie as Zoya Krupp in the feature film adaptation of The Munsters.
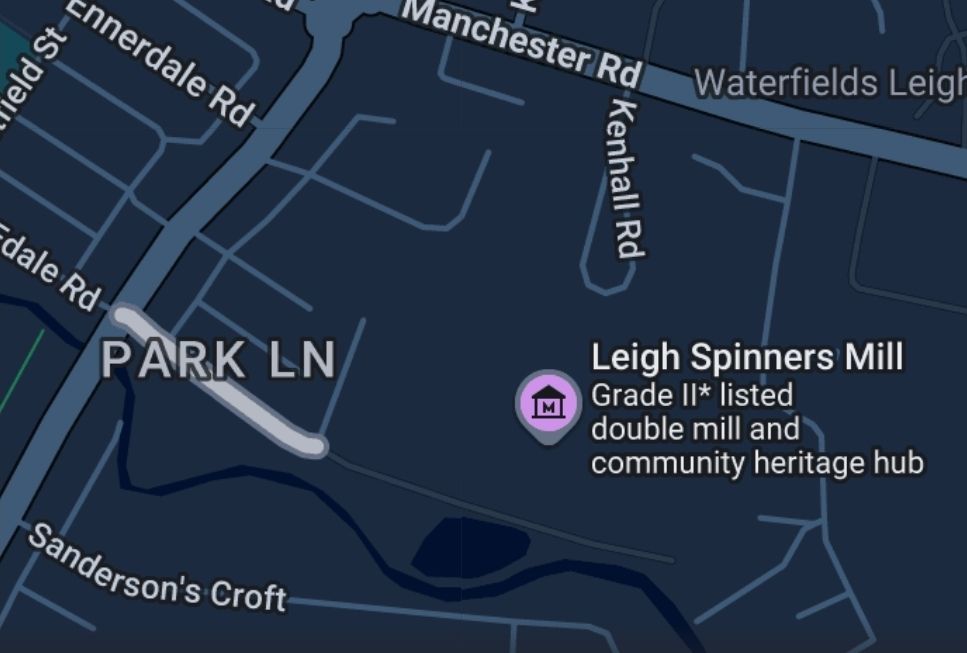
Leigh’s cotton mill heritage represents the peak and final generation of the Lancashire textile empire. Originally a dairy farming and domestic weaving town, Leigh evolved rapidly into a highly specialised fine-cotton spinning powerhouse, capitalising on local coal measures and the Bridgewater Canal.
Unlike older mill towns that grew haphazardly, Leigh’s industry peaked late, culminating in massive 20th-century “double mills” like the iconic Grade II listed Leigh Spinners Mill*. Today, these red-brick giants have transitioned from empty eyesores into thriving community hubs, arts centers, and commercial business parks.
The iconic Grade II listed Leigh Spinners Mill
Detailed Timeline Breakdown by Era
1. The Pre-Industrial & Domestic Era (Pre-1830)
Before massive brick factories dominated the skyline, textile production was a distributed, domestic industry.
1740s–1770s: Local weavers produce “fustians” (coarse cotton-linen fabrics) in their own homes. The invention of the fly shuttle and Richard Arkwright’s water frame begins to shift production from homes to early water-powered mills.
1800s–1820s: The local economy relies heavily on agriculture, domestic handloom spinning, and a flourishing silk weaving trade.
2. The Early Factory & Industrialisation Era (1830–1879)
The introduction of rotative steam engines allowing mills to move away from rivers, combined with cheap local coal, sparks Leigh’s factory revolution.
1830s: The first dedicated steam-powered cotton mills are constructed in Leigh.
1839: The “Leigh Fight” (14 August). Amid massive unemployment and Chartism protests, a mob of 2,000 workers threatens to burn down Hayes Mill. The Riot Act is read, leading to violent clashes with troops.
1858: Construction begins on the multi-storey mill on Kirkhall Lane (later known as Pennington Spinning Company).
1861–1865: The Lancashire Cotton Famine. The American Civil War blockades southern US ports. Raw cotton supplies dry up, causing widespread starvation and temporary mill closures across Leigh.
1862: F.W. Bouth founds Bouth’s Mill. []
1870s: The local silk industry collapses due to foreign competition; multi-storey silk factories like Rose Mill and Welch Mill are rapidly converted to cotton weaving.
1875: The local townships of Pennington, Westleigh, and Bedford officially merge to form the Leigh Local Board District.
3. The Boom & “Super-Mill” Era (1880–1925)
Leigh enters its golden economic age, specialising in fine-mule cotton spinning and building architectural “super-mills”.
1880s: Major industrial development concentrates along the banks of the Bridgewater Canal, including the construction of the landmark Mather Lane Mill.
1899: Leigh is officially incorporated as a Municipal Borough, reflecting its vast commercial wealth.
1905: The Butts Spinning Company constructs Butts Mill.
1911: The industry reaches its employment peak. Over 6,000 people are directly employed in Leigh’s textile sector.
1913: Entrepreneurs John Horrocks and Edward Crowther found Leigh Spinners Mill. Designed by architects Bradshaw, Gass & Hope, “Mill 1” (East Section) opens alongside its boiler house and landmark chimney stack.
1914–1918: Outbreak of World War I halts the export markets and severely disrupts further building expansions.
1923–1925: Construction resumes post-war. “Mill 2” (West Section) is completed, making Leigh Spinners one of the most complete double mill complexes in the United Kingdom.
4. The Slump, War, & Industrial Decline (1926–1999)
Global competition, lack of technical modernization, and shifting markets trigger a long, irreversible contraction.
1920s–1930s: The Great Depression triggers massive closures. Despite slumps, cotton still provides about 14% of all local employment (approx. 6,000 jobs). Pennington Mill shuts its doors in 1930.
1939–1945: World War II temporarily shifts mill focus to industrial war fabrics, and some empty sheds are utilised as prisoner-of-war camps.
1950s–1960s: Post-war decline accelerates. Butts Mill ceases spinning operations entirely in 1960. Across Lancashire, mills close at a catastrophic rate of one per week.
1969: Facing the total collapse of the cotton thread trade, Leigh Spinners Ltd structurally shifts its business model from cotton yarn spinning to carpet manufacturing.
5. Dereliction & Modern Regeneration (2000–Present)
The 21st century sees a major pivot toward preserving architectural heritage via community asset conversion.
2012: Leigh Spinners expands its manufacturing footprint to produce modern synthetic turf products for sports and landscaping.
2013: The Leigh Building Preservation Trust (LBPT) is formed to save the decaying sections of the mill and its rare Yates & Thom cross-compound steam engine. They secure a vital £75,000 restoration grant.
2018: Volunteers successfully turn the historic mill steam engine for the first time in decades. Roof repairs begin on Mill 2.
2020s: Rapid floor-by-floor expansion transforms the site into a massive dynamic space.
Present Day: Leigh Spinners Mill functions as a premier heritage centre. It hosts more than 60 local tenants, featuring sports gyms, art studios, an independent cinema, a computer museum, and community facilities.
Leigh Spinners Mill functions as a premier heritage centre
Leigh Spinners Mill is a premier heritage and community hub that has transformed a historic industrial space into a thriving cultural asset. Located in Leigh, Greater Manchester, this Grade II* listed former cotton mill stands as one of the finest and most intact double-mill complexes in the UK.
Today, managed by the Leigh Building Preservation Trust (LBPT), it functions as a vibrant mix of historical preservation, business enterprise, and creative arts.
The Heritage Experience
The Heritage Centre: Located on the first floor, it showcases a vast collection of local history displays, photographs, oral histories, and industrial artefacts discovered during the mill’s renovation.
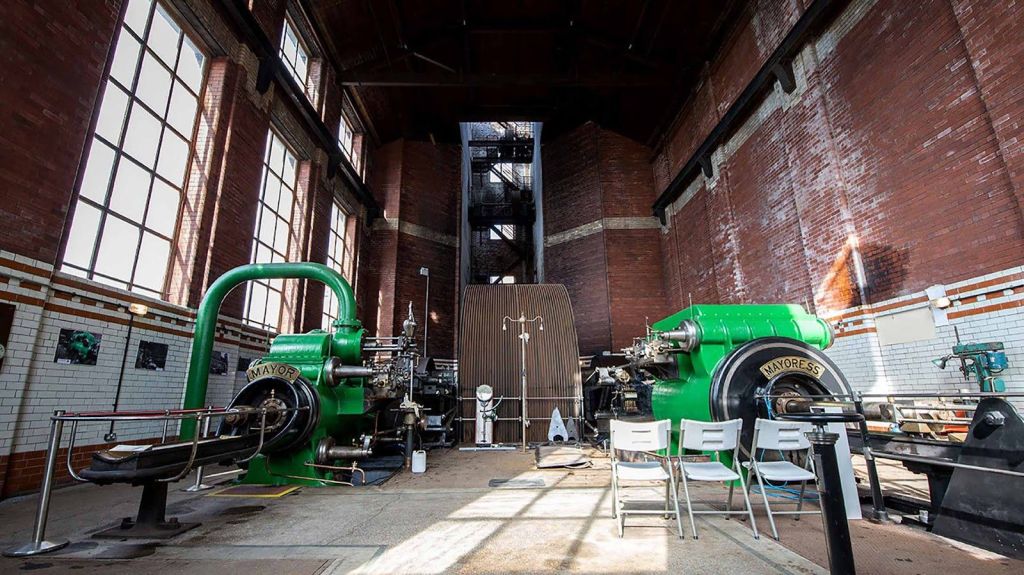
The Steam Engine House: Home to the “Mayor and Mayoress,” a massive 1,800-horsepower twin horizontal cross-compound steam engine built in 1923 by Yates & Thom. It is the largest surviving mill engine of its type in the UK.
Steam Engine House: the “Mayor and Mayoress,” a massive 1,800-horsepower steam engine
Architectural Tours: Enthusiastic volunteer guides lead public tours detailing the mill’s 20th-century Italianate and neo-Baroque architecture designed by Bradshaw Gass & Hope.
A Thriving Multi-Floor Community Hub
Beyond its industrial history, the mill has been partitioned into creative and commercial spaces housing over 80 independent businesses, charities, and sports facilities across its upper floors:
Northwest Computer Museum: A massive retro-tech attraction showcasing fully working generation-one computers and classic video game consoles like the Commodore 64 and Sinclair Spectrum amongst many others.
Sports & Leisure Floor: Features diverse athletic groups including martial arts dojos, an archery centre, a boxing club, table tennis, and yoga studios.
Retail & Amenities: Visitors can browse local maker spaces and craft workshops or relax at the mill’s local café.
Visitor Information
Address: Park Lane, Leigh, Greater Manchester, WN7 2LB.
Cost: Entry to the Heritage Centre and engine room displays is completely free of charge (donations to the trust are welcome).
Heritage Centre Opening Hours: Generally open to the public on Thursdays and Saturdays from 10:00 AM to 2:00 PM. Individual tenant hours across the rest of the mill vary daily.
Hindley Park High School (originally founded as Hindley and Abram Grammar School) was a historic secondary school located on Park Road in Hindley, Wigan, Greater Manchester. I attended the school from 1980 thru 1985.
Operating under its final name until its closure in August 1991, the institution served the local community for over three centuries. The iconic Victorian school building still stands today and serves the region as the Three Towers Academy.
Park High Secondary School, Hindley, Wigan – Overview and Timeline
Full Institutional Description
Location and Campus: Located on Park Road, Hindley, the school campus features a prominent mid-Victorian main building constructed of traditional red brick and stone dressings. The site evolved from a single large schoolroom to include a master’s house, separate classrooms, and the landmark Carlton Villas (acquired in 1937 as headmaster quarters).
Academic Identity: For most of its existence, it operated as a selective Grammar School focusing on classical education, mathematics, and sciences. In its later eras, it transitioned into a non-selective voluntary controlled secondary school managed by the Wigan Metropolitan Borough Council.
Heritage Values: The school holds deep historical significance for the Wigan borough. Its grounds feature two prominent war memorials dedicated to the alumni who perished during World War I and World War II.
Park High Secondary School, Hindley, Wigan – side view of main building
Chronological Timeline Breakdown
Era 1: The Foundations & Lowe Hall (1632 – 1855)
1632:The Hindley and Abram Grammar School is officially established through a charitable foundation. It opens inside “Lowe Hall” off Stony Lane (modern-day Liverpool Road) and is locally dubbed The Lowe School.
1829: The school updates its charter; while originally free, the Headmaster is granted the liberty to charge tuition fees for advanced instruction in Latin, arithmetic, and writing.
1848: The campus layout at Lowe Hall is formally documented for the first time on the inaugural Ordnance Survey map.
Era 2: The Park Road Relocation & Growth (1856 – 1979)
1856: The school outgrows its original home and relocates to a brand-new building on Park Road, anchoring its identity to the “Park” area of Hindley.
1882: The infrastructure expands significantly to accommodate a growing pupil registry. The site now comprises a large central schoolroom, a secondary classroom, and a dedicated headmaster’s residence.
1900s–1930s: The school undergoes rapid student growth. In 1937, the neighbouring Carlton Villas are formally purchased to serve as upgraded residential quarters for the headmaster.
1944–1970s: Following the Education Act of 1944, the school solidifies its role as a key selective grammar school for the Hindley and Abram districts, operating alongside local secondary modern alternatives.
Era 3: The 1980s Transformation (1980 – 1989)
1980–1985: Amidst a nationwide shift away from selective education, the school operates as Hindley Park High School, a voluntary controlled secondary school. It adapts its classical grammar curriculum to broader secondary education requirements.
1986–1888: Financial strain and shifting local demographics within the Wigan Council area prompt institutional reviews regarding school surplus spaces across the borough.
1989: Local education authorities begin formal consultations regarding the consolidation of secondary education in Hindley, outlining plans to phase out the historic Park Road site in favour of expanding Outwood Academy Hindley (then known as Mornington High School).
Era 4: Closure & Modern Reuse (1990 – Present)
1991: On 31 August 1991, Hindley Park High School officially closes its doors to pupils, ending 359 years of direct educational lineage.
1992–2010s: The building is preserved by the local authority and repurposed as a Teachers’ Development Centre.
2020s: The historical complex finds a permanent modern educational use. The facility is occupied by the Three Towers Alternative Provision Academy, ensuring the 1856 building continues to serve local children needing specialised support.
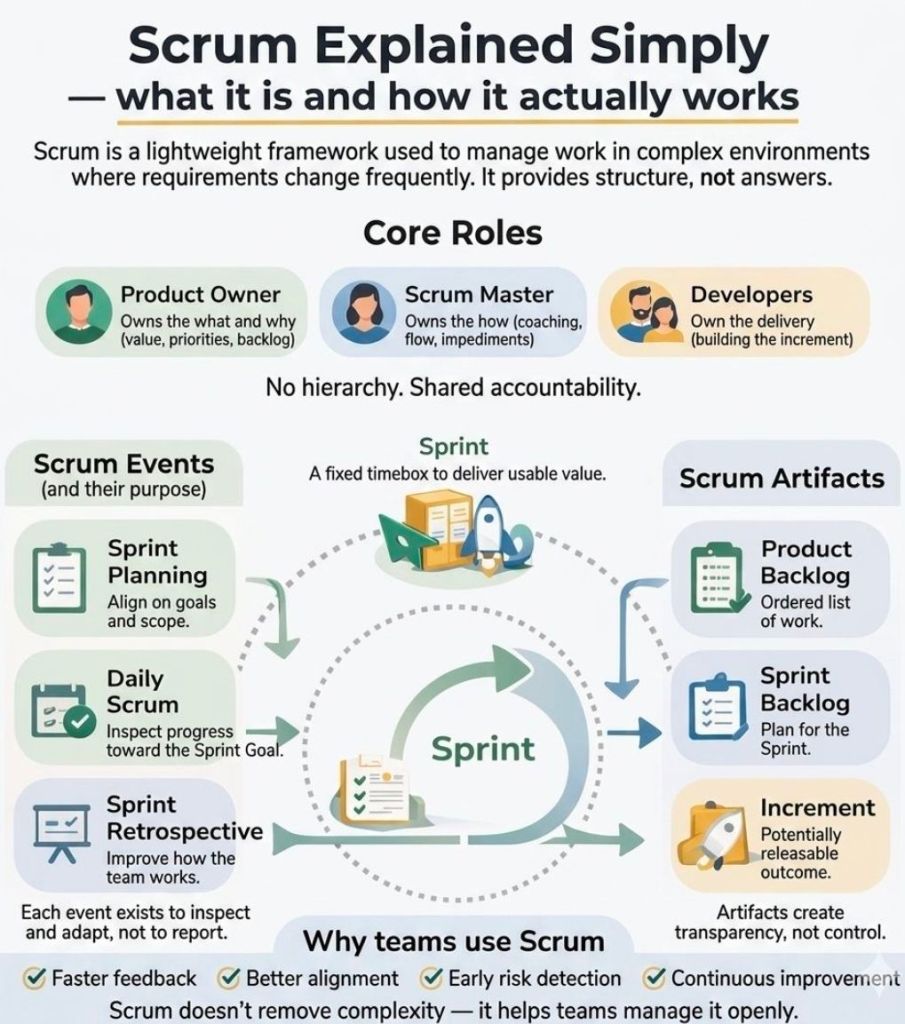
Agile is a project management philosophy, while Scrum is the structured, real-world framework used to put that philosophy into action. Think of Agile as a commitment to healthy living, and Scrum as the specific daily workout routine you follow to stay fit. Instead of planning a massive project from start to finish upfront, Scrum breaks the work down into small, manageable pieces delivered in short cycles.
The easiest way to understand Scrum is through the 3-5-3 Rule: 3 Roles, 5 Events, and 3 Artifacts.
👥 The 3 Roles
A standard Scrum team is small, cross-functional, and self-managing, meaning they have all the skills needed to complete the work without relying on outsiders.
Product Owner: The visionary. They understand customer needs, decide what needs to be built, and maintain the master to-do list.
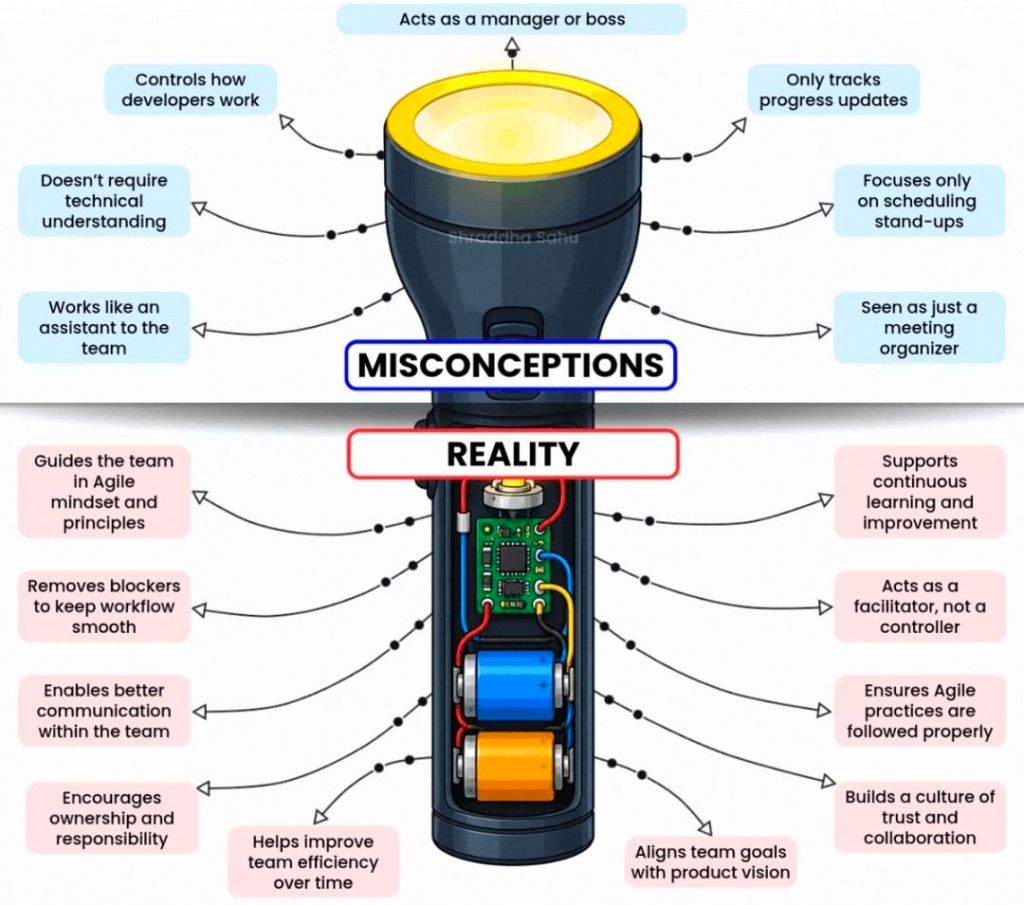
Scrum Master: The coach. They do not manage the team; instead, they protect them from distractions, facilitate meetings, and clear roadblocks.
Developers: The builders. This includes the engineers, designers, or writers who do the hands-on work and decide how to build it.
📦 The 3 Artifacts
Artifacts are simply the tangible items or lists used to maintain transparency across the project.
Product Backlog: The ultimate master list of features, fixes, and requirements needed for the product, prioritized by value.
Sprint Backlog: The specific subset of items selected from the master list that the team commits to finishing during the current cycle.
Increment: The final, working piece of the product delivered at the end of a cycle that meets the team’s “Definition of Done”.
📅 The 5 Events (Ceremonies)
Scrum operates in time-boxed blocks called Sprints, which usually last 1 to 4 weeks. Each Sprint includes four distinct meetings:
The Sprint: The time-box itself where the actual building happens.
Sprint Planning: A meeting at the start of a Sprint where the team decides what they can realistically achieve and creates a plan.
Daily Scrum (Stand-up): A quick, 15-minute daily meeting where developers sync on progress, plan the next 24 hours, and flag blockers.
Sprint Review: A showcase held at the end of the Sprint to demo the working increment to stakeholders and gather feedback.
Sprint Retrospective: An internal team meeting to review what went well, what went wrong, and how to improve the process for the next Sprint.
🏗️ Why Does Scrum Work?
Scrum relies entirely on Empiricism, meaning making decisions based on real-world evidence rather than guesswork. It stands firmly on three pillars:
Transparency: Everyone involved sees exactly what is happening.
Inspection: The team frequently stops to check the quality of the product and progress.
Adaptation: If something goes off-course, the team shifts direction immediately rather than blindly following an outdated plan.
Mark Whitfield is an SC-cleared Senior IT Project and Engagement Manager with over 30 years of experience. His career spans from early mainframe programming to leading multi-million-pound cloud migrations and digital transformations for major financial, utility, and government clients.
The chronological breakdown of his professional project portfolio, structured by his definitive career eras, is detailed below:
1. The Technical Era (1990–1995)
During this foundational era, Mark worked as a Programmer and Lead Analyst for The Software Partnership (acquired by Deluxe Data in 1994). He focused strictly on the development, optimization, and deployment of the sp/ARCHITECT-BANK electronic banking solution on Tandem Mainframe Computers.
Details: Handled the custom design and backend coding for a high-profile desktop electronic business banking application.
Project: Automated Touch-Tone Phone Banking Suite
Year: 1992–1993
Client: Girofon (Denmark)
Budget: Client-retained vendor contract
Details: Coded automated, menu-driven voice solutions operating on a Periphonics VRAM device to fetch live customer balances directly from mainframes.
Project: Early Digital Inter-Account Transfers
Year: 1993–1994
Client: TSB & Bank of Scotland
Budget: Internal product development
Details: Directed logic design and mainframe coding to support pioneering inter-account electronic funds transfers.
Project: International Banking Optimization
Year: 1994–1995
Client: Rabobank
Budget: Vendor-driven custom development framework
Details: Managed localized software optimization, custom patches, and deployment testing for global banking operations.
2. The Infrastructure & Monitoring Era (1995–2014)
Mark transitioned into a Product and Project Manager role at Insider Technologies Limited (and later a brief stint at Wincor Nixdorf). His focus shifted heavily toward platform diagnostics, high-availability transaction monitoring, and financial hardware software integrations.
Project: Reflex (Reflex 80:20) System Co-Development
Year: 1995–2004
Client: Multiple Tier-1 Investment Banks (including Euroclear/Crestco, Bank of England, and Deutsche Bank)
Budget: Part of a broader £3M Management Buyout (MBO) product portfolio
Details: Acted as Senior Programmer and Technical Lead to co-develop diagnostic monitoring modules for high-availability mainframes.
Details: Managed the integration of transaction tracking across ATM networks using ACI’s XPNET and HP NonStop architecture.
Project: Legacy ATM Software Modernisation
Year: 2013–2014
Client: Major UK Retail Bank (via Wincor Nixdorf Professional Services)
Budget: Corporate financial service transformation
Details: Served as Project Manager executing the swap-out of outdated, legacy ATM client systems for modernized software stacks.
3. The Digital and Cloud Era (2014–Present)
This era highlights Mark’s leadership of large-scale Agile and Waterfall digital delivery frameworks, moving from corporate gambling technology to complex, high-budget UK public sector programs.
Project: Mobile & Online Gaming Sportsbook Platforms
Details: Led Agile Scrum development teams to upgrade payment gateways, implement fraud detection, and roll out football/horse racing mobile interfaces.
Project: National Air Space Real-Time Mobile Applications
Year: 2016
Client: NATS (UK-wide Air Traffic Organisation)
Budget: Corporate custom applications initiative
Details: Managed the secure Agile delivery of Apple iOS applications displaying live military and public airspace information.
Project: Core Systems Interface Data Centre Migration
Year: 2016 (May–October)
Client: Royal Mail Group (RMG) / Postal Services
Budget:£4.3 Million
Details: Led a massive cross-functional team of 90 Capgemini engineers to migrate over 1,100 platform data interfaces ahead of peak annual trading.
Project: Automated Call Centre CCaaS Telephony Implementation
Year: 2017 (May onwards)
Client: Local Regional Government
Budget:£400,000
Details: Deployed a programmatic dialler system linked with Microsoft Azure CRM to facilitate the “Support for Mortgage Interest” campaign.
Project: Automotive Online Car Sales and Digital Readiness
Year: 2017 (October)
Client: Jaguar Land Rover (JLR) / Aston Agile Delivery Centre
Budget:£1.1 Million (Split into a £670k Customer Sales Portal and a £430k Readiness project)
Details: Engagement Manager implementing a new-car ecommerce vehicle pipeline.
Budget:£1 Million+ (Part of a larger £13.5M cloud program moving 130 apps)
Details: Orchestrated the launch and configuration of Azure Cloud frameworks migrating 12 historical Dynamics 2016 platforms to Dynamics 365 Online.
Project: Fish Export Service (FES) to CHIP Inspection Portal
Year: 2023–2024 (Nov–Feb)
Client: UK Government / Northern Ireland Trading Framework
Budget:£1 Million+
Details: Served as Technical Delivery Manager directing Agile Scrum teams to build cloud-hosted APIs supporting catch verification under the Windsor Framework.
Columbo is one of television’s most celebrated crime dramas, spanning 35 years, 69 episodes, and two major television networks. Starring Peter Falk in his four-time Emmy-winning role, the show completely upended standard detective tropes with its signature “inverted detective story” structure.
Peter Falk, Columbo
The following guide breaks down the core characteristics of the series, followed by a comprehensive, year-by-year chronological timeline of its production and broadcasting history.
Detailed Description of the Series
The Inverted “Whodunit” (The Howcatchem)
Unlike standard mystery shows where the audience tries to guess the killer, Columbo is an inverted detective story. Every episode begins by showing the audience exactly who the murderer is, their motive, and the elaborate steps they take to craft an “airtight” alibi. The true tension and entertainment lie in the psychological cat-and-mouse game between the killer and Lieutenant Columbo, watching him slowly pick apart their flawless crime.
The Character of Lieutenant Columbo
The Appearance: Columbo is famously dishevelled. He wears a rumpled, beige raincoat over a wrinkled suit, drives a battered 1959 Peugeot 403 convertible, and frequently chomps on a half-burned cigar.
The Tactics: He acts incredibly humble, forgetful, and easily distracted. This is a deliberate ploy to make the high-society killers underestimate him, causing them to let their guard down and talk too much.
The Catchphrase: Just as a suspect believes Columbo is leaving and they have gotten away with murder, he stops, turns around, scratches his head, and delivers his iconic phrase: “Just one more thing…”
Personal Quirks: He works for the Los Angeles Police Department (LAPD), never carries a gun, loves chili with crackers, owns an incredibly lazy basset hound simply named “Dog”, and constantly references his unseen wife, Mrs. Columbo.
Detailed Production & Broadcast Timeline
The history of Columbo spans across two distinct network eras: the NBC Era (the original 1970s run) and the ABC Era (the late 1980s revival through to the final specials).
Pre-Falk Origins (1960 – 1962)
1960: Writers Richard Levinson and William Link introduce the character of “Lieutenant Columbo” in an episode of the anthology series The Chevy Mystery Show titled “Enough Rope”, played by actor Bert Freed.
1962: The writers adapt the story into a stage play named Prescription: Murder, where Columbo is portrayed by Oscar-winner Thomas Mitchell.
The NBC Series Era (1971 – 1978)
During this run, Columbo does not air weekly. Instead, it serves as a rotating program on The NBC Mystery Movie alongside shows like McCloud and McMillan & Wife.
1971:Season 1 begins. The official premiere episode, “Murder by the Book”, is directed by a young, pre-fame Steven Spielberg.
1972:Season 1 concludes, and Season 2 premieres in September. This season includes classics like “Etude in Black”.
1973:Season 2 ends, and Season 3 launches, introducing “Any Old Port in a Storm”, which features Donald Pleasence and is widely considered one of the best episodes of the series.
1974:Season 3 wraps up, and Season 4 premieres. It features Johnny Cash in “Swan Song” and Dick Van Dyke in “Negative Reaction”.
1975:Season 4 concludes, and Season 5 debuts in the autumn, featuring the episode “Forgotten Lady”.
1976:Season 5 ends. Season 6 premieres in October with a shortened, three-episode order as Peter Falk begins negotiating fiercely over his contract and salary.
1977:Season 6 wraps up. Season 7 launches in November, highlighting the fan-favourite episode “Try and Catch Me” starring Ruth Gordon.
1978: The final NBC episode, “The Conspirators”, airs in May. Burnt out by the rigorous schedule and wanting to pursue feature films, Peter Falk walks away from the character, ending the original run.
The Hiatus & Spin-Off (1979 – 1988)
1979: NBC attempts to keep the brand alive without Falk by launching a spin-off series, Mrs. Columbo, starring Kate Mulgrew. It is heavily rejected by fans and swiftly cancelled.
1980–1988:Columbo remains entirely dark for nearly a decade.
The ABC Revival Era (1989 – 2003)
ABC successfully strikes a deal with Peter Falk to bring the detective back for a series of premium, two-hour television movies.
1989: After an 11-year absence, Columbo returns to television with Season 8. Later that year, Season 9 launches.
1990:Season 9 concludes in May. ABC abandons the rigid, seasonal formatting, shifting the series into occasional, high-budget “TV Specials”. Season 10 officially begins with “Columbo Goes to College” in December.
1991: Three major movie specials are broadcast: “Caution: Murder Can Be Hazardous to Your Health”, “Columbo and the Murder of a Rock Star”, and “Death Hits the Jackpot”.
1992: Two movie specials air: “No Time to Die” (a rare episode where Columbo solves a kidnapping rather than a murder) and “A Bird in the Hand…”.
1993: Only one special is produced and broadcast this year: “It’s All in the Game”, written by Peter Falk himself.
1994: Two movie specials air: “Butterfly in Shades of Grey” (featuring William Shatner’s second appearance as a Columbo villain) and “Undercover”.
1995: A single movie special is broadcast: “Strange Bedfellows”, co-starring George Wendt.
1997: Following a brief hiatus, “A Trace of Murder” airs to celebrate the 30th anniversary of the franchise.
1998: The movie special “Ashes to Ashes” is broadcast, featuring Patrick McGoohan, who also directed several episodes of the series.
2001: “Murder With Too Many Notes” airs after a multi-year delay in production.
2003: The 69th and final episode, “Columbo Likes the Nightlife”, airs on 30 January. This concludes the historic run of the franchise, as Peter Falk formally retires from playing the character before his passing in 2011.
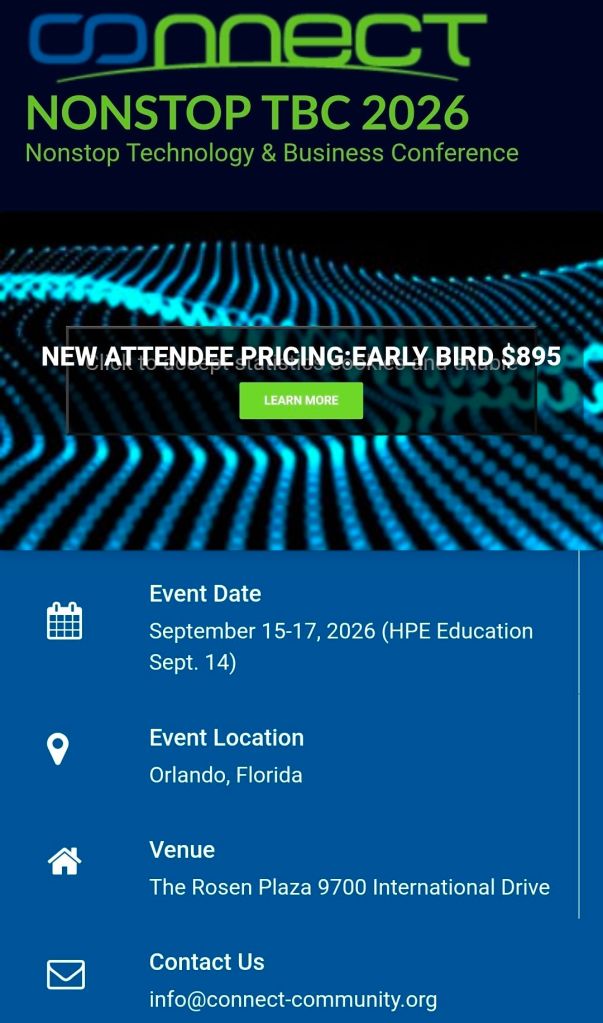
The HPE NonStop Technology & Business Conference (Nonstop TBC 2026)—hosted by Connect Worldwide—will take place from September 14 to September 17, 2026, at The Rosen Plaza in Orlando, Florida.
This signature annual event brings together enterprise IT leaders, software engineers, and solution architects to explore innovations shaping mission-critical environments.
Core Event Schedule
The four-day conference partitions its educational and collaborative tracks as follows:
September 14: Dedicated exclusively to HPE Education Day, featuring expanded deep-dive technical pre-conference courses.
September 15–17: The primary conference technical program and breakout sessions.
Key Focus Areas & Tracks
The 2026 event focuses heavily on bridging mission-critical legacy stability with modern software frameworks:
AI-Driven Transformation: Adapting continuous availability to the demands of modern artificial intelligence and machine learning workloads.
Digital Resilience & Security: Mitigating modern risks, modernising backup systems, and maintaining absolute runtime security.
FinTech & Payments: Real-world operational strategies from global peers managing transaction-heavy workloads.
Expanded Business Track: New for 2026, this track aligns executive business drivers with technical architectures for practical IT roadmap building.
Logistics and Pricing
Venue: The Rosen Plaza Hotel, situated at 9700 International Drive, Orlando, Florida.
Pricing: A newly reduced Early Bird Registration ticket is available for $895.
Accommodations: Registered attendees gain access to a dedicated Connect block rate of $181 per night (including tax).
Sponsorships: Major industry partners, such as comforte, sponsor the event, granting enterprise buyers direct visibility into third-party NonStop infrastructure add-ons.
Centiun is a UK-based Microsoft AI Cloud Partner and IT consultancy specializing in digital transformation, cloud migration, and AI integration for public and private sector organizations.
Centiun is a UK-based Microsoft AI Cloud Partner and IT consultancy
They help businesses modernize operations, leverage low/no-code platforms, and transition legacy infrastructure to secure cloud environments.
Core Services
Cloud & App Modernization: Migrating on-premise, legacy applications to secure cloud environments to reduce costs and enhance agility.
Microsoft AI & Business Applications: Implementing solutions across the Microsoft stack, including Copilot, Power Platform, and Dynamics 365, to improve process efficiency and data-driven decision-making.
Managed Services & Governance: Providing SLA-compliant technical governance, threat monitoring, and support to ensure business continuity.
Training & Enablement: Upskilling staff to confidently use Microsoft tools and low-code solutions.
Target Industries
Centiun tailors their technology solutions to several specialized sectors, offering domain expertise in:
Healthcare and Non-profits
Public Bodies and Central Government
Financial Services and Manufacturing
Energy and Utilities
Why They Stand Out
Microsoft Expertise: Their seasoned experts hold numerous Microsoft certifications and boast a combined 20+ years of experience in Microsoft Business Applications.
Tailored Approach: They focus on personal service rather than one-size-fits-all solutions, aiming to help clients scale and modernize while minimizing operational disruption.
Security & Trust: The firm operates with strict data security measures, holding accreditations like Cyber Essentials and registration with the Information Commissioner’s Office (ICO).
Explore their complete list of solutions and case studies directly on the Centiun Official Website.
Agile project management is an iterative, adaptive approach that breaks projects down into small, manageable cycles called sprints or iterations. Instead of planning the entire project upfront, teams continuously deliver functional increments, gather immediate feedback, and adapt to changing requirements. It prioritizes team collaboration, customer involvement, and rapid value delivery over rigid documentation and sequential phases.
Comprehensive Timeline Breakdown by Era and Year
Era 1: The Foundational Seeds (1950s – 1980s)
Before “Agile” existed as a formal term, engineers and researchers laid the groundwork through lean manufacturing and early iterative computing.
1957: IBM begins utilizing incremental development concepts under Gerald M. Weinberg.
1958: Software for Project Mercury (NASA’s first human spaceflight program) is developed using rapid half-day iterations.
1970: Dr Winston Royce publishes a paper describing the Waterfall methodology. Paradoxically, he presents it as high-risk, yet it becomes the dominant, rigid corporate framework for decades.
1980: Toyota refines “Just-In-Time” logistics and visual management system concepts, which later directly inspire Kanban and Lean software practices.
1986: Authors Hirotaka Takeuchi and Ikujiro Nonaka publish “The New New Product Development Game” in the Harvard Business Review. They introduce a holistic, “rugby-style” team approach, coining the term “Scrum”.
1988: Dr Barry Boehm introduces the Spiral Model, formalizing risk-driven, iterative lifecycle planning.
Era 2: The “Lightweight” Revolt (1990s)
Driven by frustration over the high failure rates and slow delivery of Waterfall, software pioneers independently build faster, more flexible frameworks.
1991: James Martin formalizes Rapid Application Development (RAD), highlighting timeboxing, prototyping, and active customer involvement.
1993: Jeff Sutherland, John Scumniotales, and Jeff McKenna deploy the very first operational Scrum process at Easel Corporation.
1994: The Dynamic Systems Development Method (DSDM) is launched in the UK, providing one of the earliest structured frameworks for iterative project delivery.
1995: Ken Schwaber and Jeff Sutherland co-present the formal Scrum Framework to the public at the OOPSLA conference.
1996: Kent Beck introduces Extreme Programming (XP), introducing core engineering mechanics like pair programming and test-driven development (TDD).
1997: Jeff De Luca and Peter Coad design Feature-Driven Development (FDD) to focus strictly on client-valued functional results.
Era 3: The Manifesto Moment (2000 – 2001)
The pivotal pivot point where separate iterative movements unite into a single, cohesive global movement.
2000: Pre-meeting alignment occurs. Martin Fowler publishes his definitive article on Continuous Integration (CI), and Extreme Programming teams begin adopting Scrum’s three-question daily standup format.
February 2001: The Agile Manifesto is Born. Seventeen software development pioneers meet at a ski resort in Snowbird, Utah. They discover common ground, author the Manifesto for Agile Software Development, and establish the 4 Core Values and 12 Principles.
Late 2001: The Agile Alliance non-profit is established to safeguard, evolve, and distribute Agile education globally.
Era 4: Mainstream Adoption & Scaling (2002 – 2019)
Agile shifts from a rebellious IT trend into a standard corporate expectation, requiring frameworks that can scale across massive enterprises.
2002: Ken Schwaber co-founds the Scrum Alliance to offer standardized certifications (like Certified ScrumMaster), dramatically accelerating global adoption.
2003: Mary and Tom Poppendieck publish Lean Software Development, cleanly mapping Toyota’s manufacturing efficiencies directly onto digital projects.
2009: The Software Craftsmanship Manifesto is created to ensure technical excellence and code quality are not forgotten during rapid business sprints.
2011: Dean Leffingwell releases the Scaled Agile Framework (SAFe), allowing massive corporate enterprises to align hundreds of agile teams across entire portfolios.
2015: Global project management authorities officially pivot; AXELOS releases PRINCE2 Agile, and the Project Management Institute (PMI) introduces Agile certifications into its core curriculum.
Era 5: Modern Continuous Agility (2020s – Present)
Agile transcends IT entirely, cementing its place as an overarching organizational strategy for business survival in an uncertain world.
2020: The Scrum Guide receives its most significant structural update, streamlining language, eliminating prescriptive micro-management, and focusing intensely on a single, unified team working toward a singular “Product Goal”.
2021–2023: Business Agility explodes. Non-technical departments—including HR, Marketing, Legal, and Finance—broadly restructure their workflows into iterative agile backlogs to manage volatile hybrid work environments.
2024–Present: AI-Driven Agility becomes standard practice. Project management tools use generative AI to automatically draft user stories, estimate team velocity, and dynamically rewrite project sprint backlogs based on real-time market shifts.