The full toolkit of Mark Whitfield’s Project Management (PM) templates is structured below according to structural focus areas, overview of utility, and native file formats. Free upgrades and additions after purchase.
📅 Project Planning & Roadmapping
Focus: Schedule design and milestone visualization for SDLC, PRINCE2, and Agile.
Overview: Builds work breakdown structures (WBS), tracks timelines, and presents milestones to stakeholders.
Format: Microsoft Project (.mpp), Excel (.xlsx), and PowerPoint (.pptx).
Included: Detailed plans, Excel Gantt trackers, over 35 Plan on a Page (POaP) slides, and spreadsheet-based timelines.
⚠️ Risk, Governance & Operational Control
Focus: Threat tracking, dependency mitigation, and accountability.
Overview: Ensures structural control and compliance, managing risks, issues, and resource ownership.
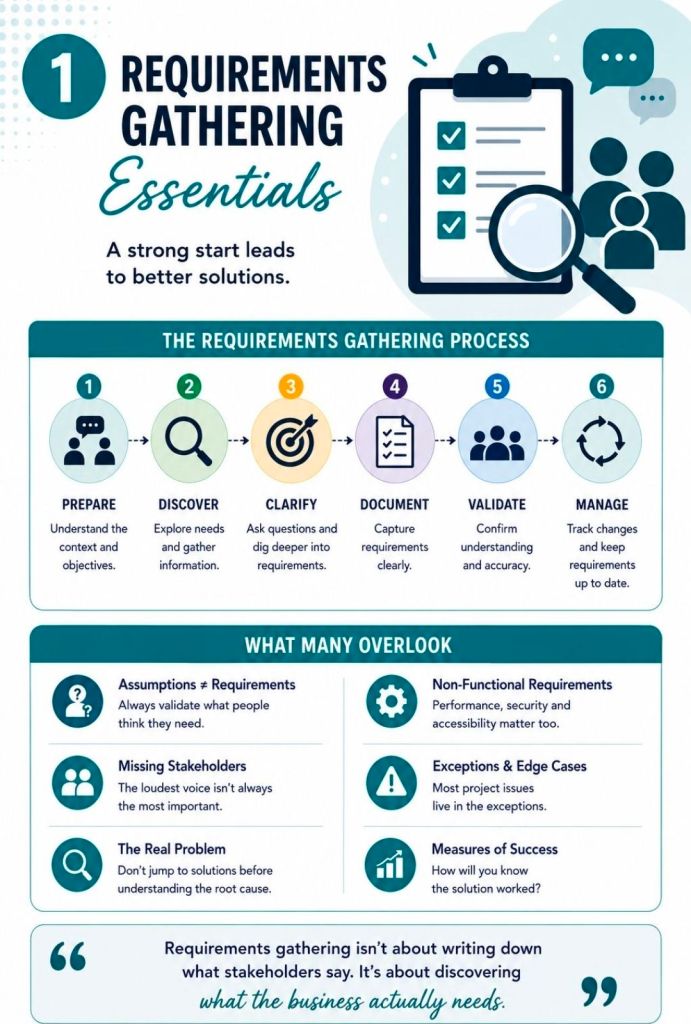
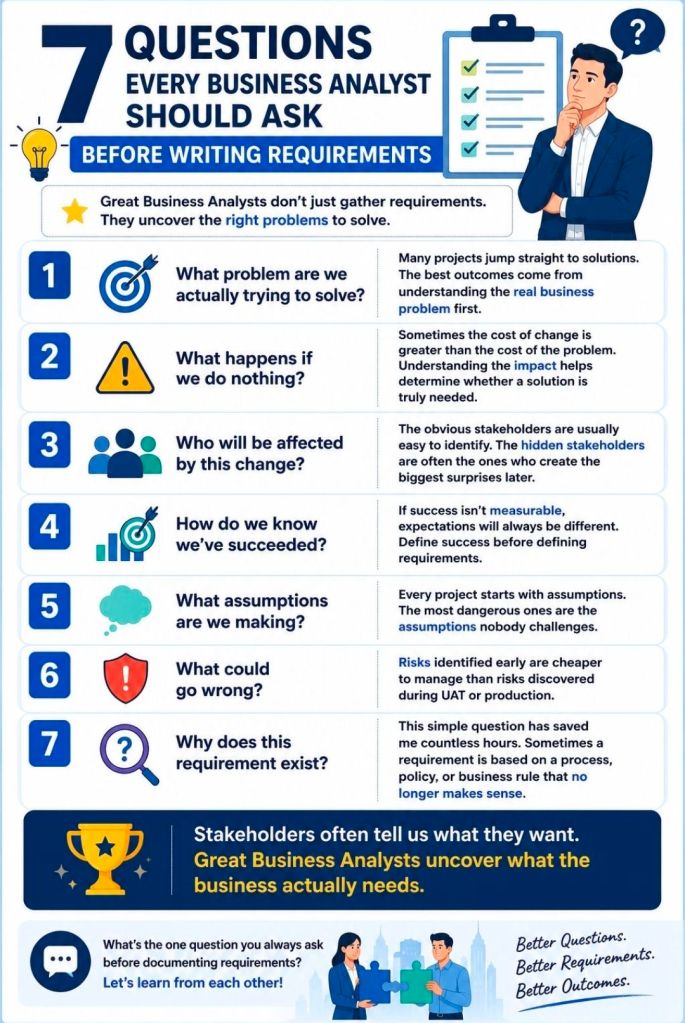
Requirements gathering is the foundational process of identifying, documenting, and managing what a project must achieve to deliver maximum business value. According to the Project Management Institute (PMI), nearly 70% of project failures are directly attributed to poor requirements collection, highlighting its role as the ultimate “scope anchor” for project managers.
Below is an overview of the core steps, techniques, classification categories, and tracking methods needed to establish an airtight requirement framework.
The 6-Step Requirements Gathering Process
Executing a structured lifecycle ensures that raw client requests are transformed into precise, measurable technical blueprints.
Identify and Analyze Stakeholders
Map out every individual invested in the project baseline.
Separate them into internal (executives, developers) and external entities (vendors, customers).
Utilize a stakeholder register to analyze their influence and prioritize conflicting needs early.
Establish Goals and Alignment
Define overarching high-level business milestones before hunting for product features.
Separate broad targets (goals) from specific deliverables or tasks (objectives).
Filter out scope proposals that fail to directly support these core goals.
Elicit Stakeholder Requirements
Conduct interactive discovery sessions tailored to user availability and project context.
Use direct one-on-one sessions for specific detail validation.
Use data gathering structures for broader user bases.
Document and Categorize
Translate conversational feedback into clear, unambiguous definitions.
Store information inside a centralized, accessible collaborative hub.
Record relevant project assumptions and hard technical boundaries.
Prioritize and Validate
Organize requests into strict low, mid, or high urgency classifications.
Apply prioritization frameworks like MoSCoW (Must-have, Should-have, Could-have, Won’t-have).
Conduct structured internal reviews to confirm value connection back to the business.
Baseline Sign-off and Change Control
Request formal verification from the main project sponsors.
Set a fixed baseline to prevent unauthorized project feature updates.
funnels all future adaptations through a strict change control system.
Core Categories of Requirements
To prevent scope gaps, information must be analyzed from a 360-degree technical and strategic perspective.
Business Requirements: Define the ultimate overarching problem or strategic objective the business needs to resolve.
Stakeholder Requirements: Capture the specific desires, expectations, and operational pain points of the end users.
Functional Requirements: Spell out exactly what the target solution must execute or how a user interacts with it.
Non-Functional Requirements: Specify system traits such as performance, data security parameters, and growth scalability.
Technical Requirements: Detail the internal IT setups, environments, and languages the project must operate inside.
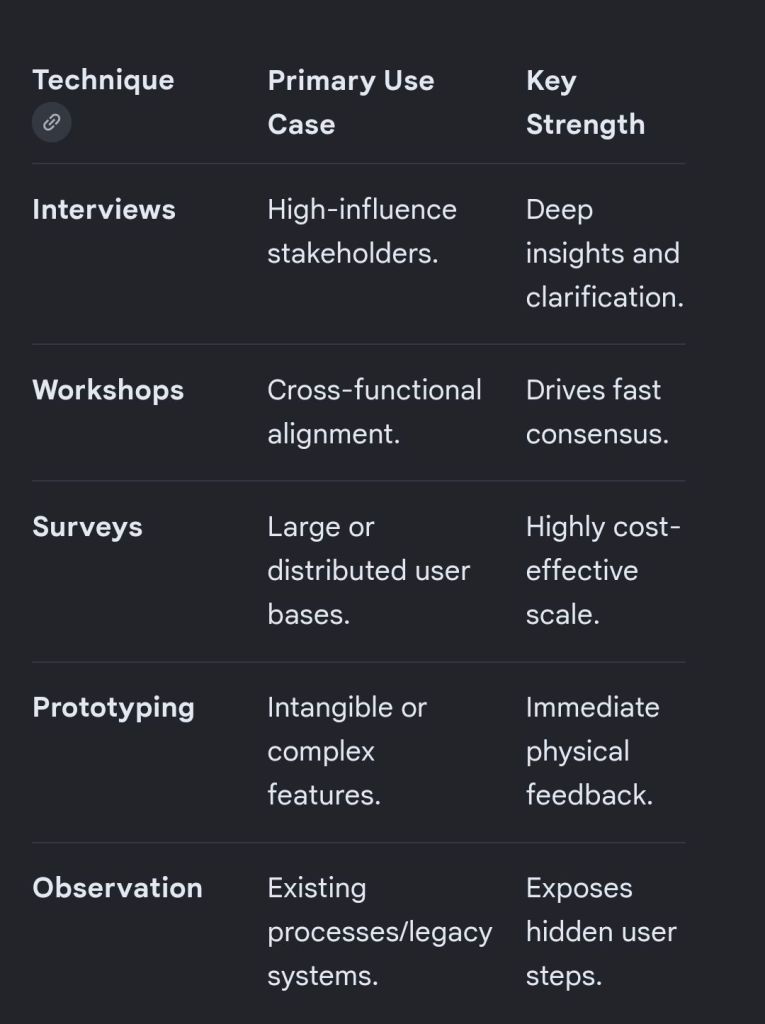
Essential Gathering Techniques
Choosing the right collection methodology depends on the size of your audience and the technical complexity of the work.
Project Requirements Gathering Essentials
Scope Governance: The Traceability Matrix
Once requirements are baselined, they are tracked using a Requirements Traceability Matrix (RTM). This tool links every approved feature back to its source stakeholder and forward into production and testing.
Bi-Directional Tracking: Traces forward from need to test case, and backward from code to initial business authorization.
Eliminates Scope Creep: Ensures that development engineering teams only spend resources on validated features.
Prevents Orphaned Elements: Flags code built without initial business justification, or targets missing a test plan.
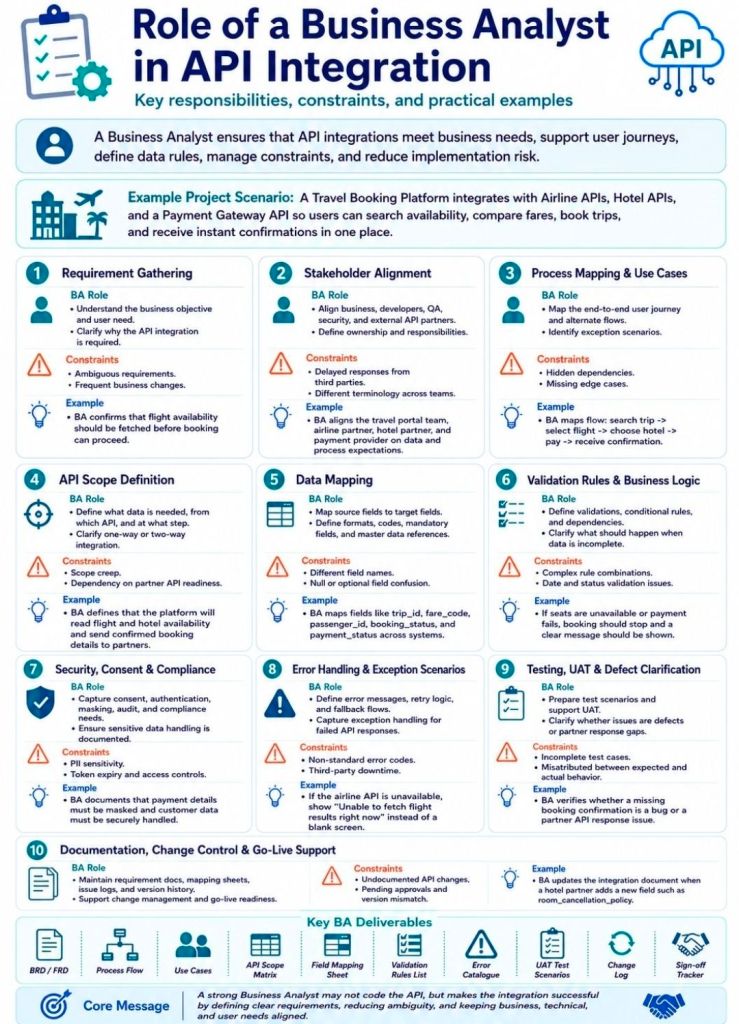
A Business Analyst (BA) acts as the critical bridge between business stakeholders and technical teams. In API integration, the BA translates strategic business goals into clear technical requirements. They ensure systems communicate seamlessly, align with business rules, and support the overall customer journey.
Core responsibilities for a BA in API integration include:
Requirement Gathering: Translating business needs into precise functional and non-functional requirements, such as payload data requirements, expected response times, and security protocols.
Data Mapping: Defining exactly how data fields correspond across different systems (e.g., matching a CRM’s “Client Name” to a billing system’s “Customer”) and determining data transformation rules.
Defining Scenarios: Detailing the API’s behavior for both standard workflows and edge cases, such as handling invalid login attempts, rate limiting, and system timeouts.
Documentation & Modeling: Using sequence diagrams and flowcharts to visually map out how systems interact, and producing clear Interface Control Documents (ICD).
User Stories & Acceptance Criteria: Writing integration-focused user stories for Agile backlogs, including specific HTTP methods, request/response formats, and error codes.
Facilitating Collaboration: Bridging the communication gap by translating technical constraints to non-technical stakeholders and business objectives to developers.
Testing & UAT Support: Assisting the QA team in validating API endpoints using tools like Postman, and ensuring requirements are met during User Acceptance Testing (UAT).
An API (Application Programming Interface) is a set of rules that lets different software programs communicate and share data with each other. Think of it like a waiter in a restaurant: you (the application) place an order (a request), and the waiter takes it to the kitchen (the server) and brings back exactly what you asked for.
API (Application Programming Interface) for Business Analysts BA
How They Work
The Request: One program asks another for specific data or actions using an API call.
The Rules: The API dictates exactly how this request must be formatted to ensure security and consistency.
The Response: The receiving program processes the request and sends the requested information or executes the task.
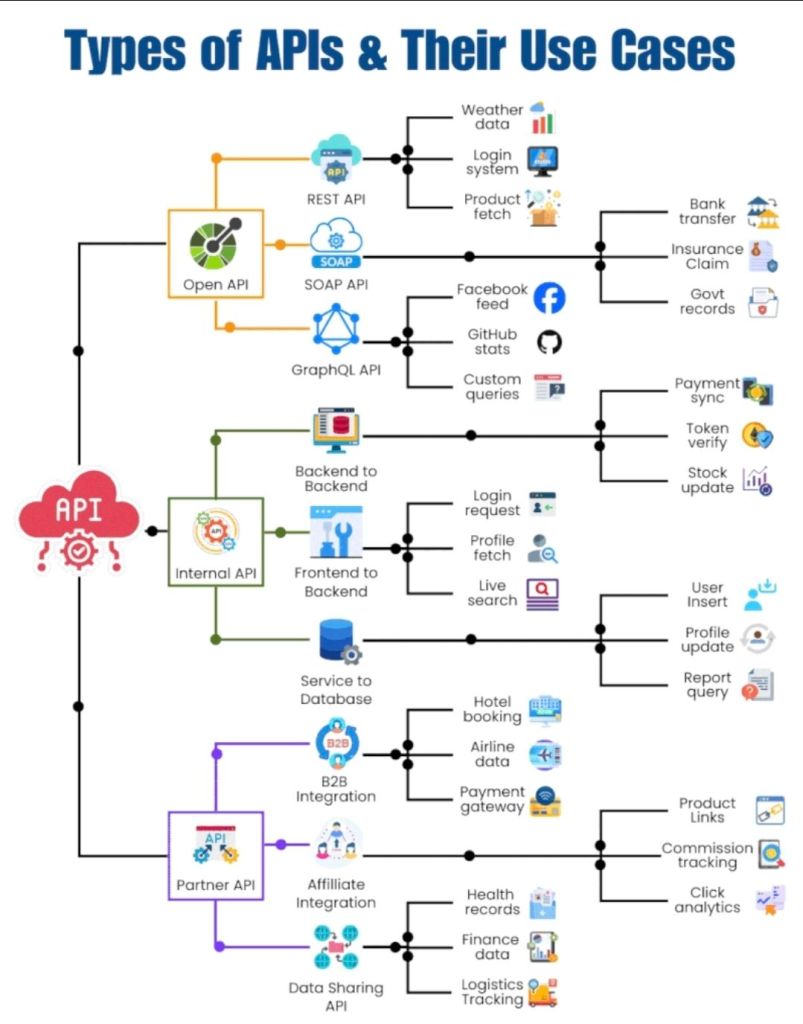
For business analysts (BAs), APIs are crucial business enablers that connect systems, automate workflows, and drive revenue. Categorizing APIs helps BAs identify technical impacts, scope integration requirements, and align solutions with strategic business goals.
Categorization can be divided into three primary frameworks: Access Level, Business Purpose, and Architecture Style.
1. By Access Level (Audience)
This categorization defines who has permission to use the API and dictates security requirements.
Internal (Private) APIs: Developed by a company strictly for internal use. These connect backend systems (e.g., a CRM talking to an ERP) or allow different internal departments to share data securely.
Partner APIs: Shared specifically with external business partners or vendors. These require strict authentication and agreements to streamline supply chain or B2B operations (e.g., granting a distributor inventory access).
Public (Open) APIs: Exposed to developers and the general public to foster third-party integrations, app development, or ecosystem growth. They often require an API key or OAuth for tracking usage.
2. By Business Purpose (API-led Connectivity)
This approach, often used in integration methodologies like MuleSoft, categorizes APIs by their role in the enterprise architecture.
System APIs: Unlock data directly from core systems of record (e.g., a legacy database, an ERP, or a billing system).
Process APIs: Interact with and shape data across multiple systems to break down data silos (e.g., an API that takes order fulfillment data and formats it for shipment and inventory updates).
Experience APIs: Provide a business context for the data to be easily consumed by end-user interfaces like mobile applications, web portals, or chatbots (e.g., fetching a 360-degree customer view).
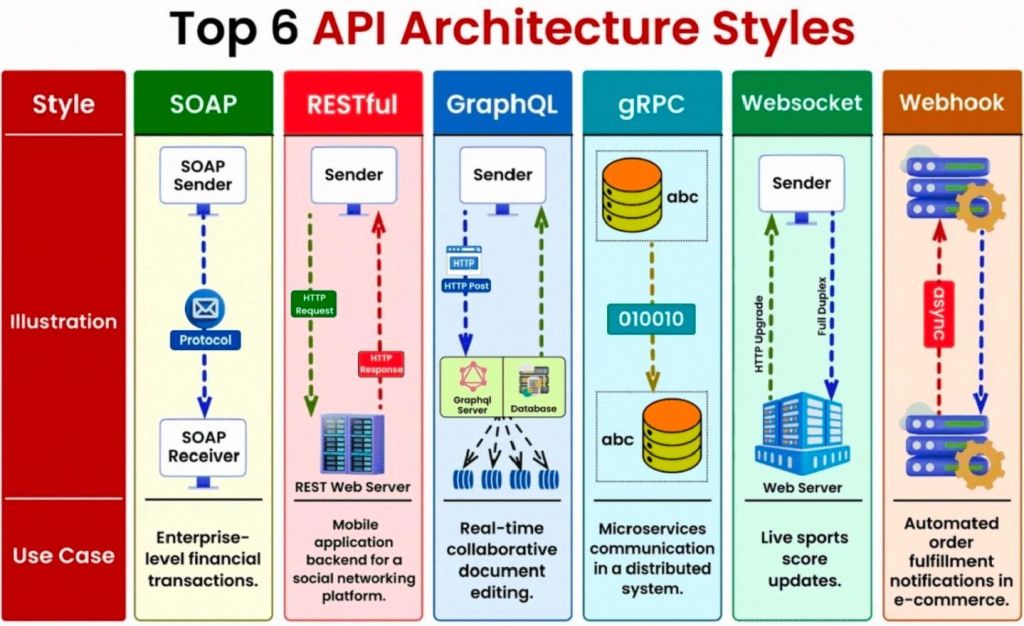
3. By Architecture Style (Technical Format)
While solution architects define the exact protocol, BAs must understand these styles to document data flow, map payloads, and communicate limitations with developers.
REST (Representational State Transfer): The most common web API standard. It uses HTTP methods to transfer data in simple formats like JSON.
SOAP (Simple Object Access Protocol): An older, highly structured protocol heavily used in enterprise and highly regulated industries (like banking and healthcare).
GraphQL: A query language for APIs that allows the client (e.g., a mobile app) to request exactly the specific data it needs, rather than fetching entire datasets.
Webhooks: Automated, event-driven APIs. Rather than a client requesting data, the server “pushes” data to the client the moment a specific event happens (e.g., sending a receipt to an app the instant a payment clears).
API Architecture Styles
Key API Concepts for BAs
Business analysts rarely build APIs, but they must understand high-level concepts to document API requirements effectively:
Payload: The data that is being sent (Request) or received (Response).
CRUD / HTTP Methods: The basic actions mapped to data. BAs need to understand GET (Read), POST (Create), PUT/PATCH (Update), and DELETE (Remove).
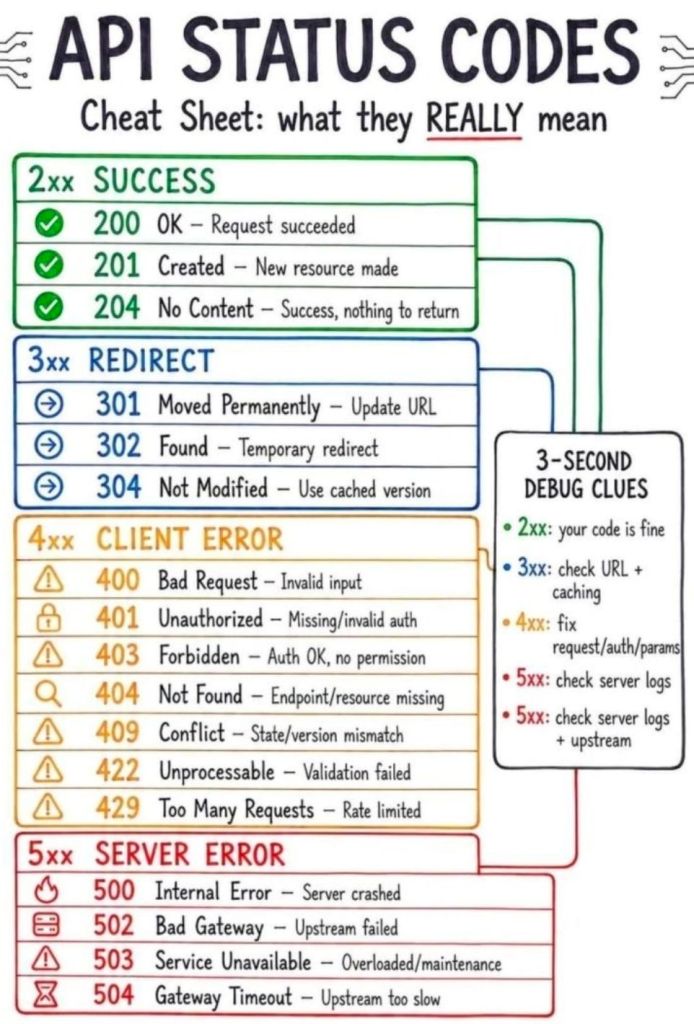
Status Codes: Standardized numbers that indicate the result of a request (e.g., 200 for success, 404 for not found, or 500 for server error).
Documentation: BAs use standards like Swagger/OpenAPI to interpret how an API should behave.
API Status Codes – standardized numbers that indicate the result of a request
API (Application Programming Interface) for Business Analysts BA
The i_Pro_PM_Templates collection on Flevy is a highly comprehensive library of 19 specialized project management resources spanning Waterfall and Agile methodologies. Developed by a contributor with 30 years of project management experience, these fully editable files (PowerPoint, Excel, Word, and MS Project) are designed to bridge corporate strategy with rapid execution. The complete 200+ template ZIP file package can be purchased here also.
The specific templates offered by i_Pro_PM_Templates are organized below by their operational category and core function:
🗺️ 1. Project Planning & Roadmaps
Designed to provide executive stakeholders and project teams with high-level visualization and structured timelines.
Plan on a Page (PoaP) 30+ Examples (PowerPoint): Synthesises complex timelines into an executive-ready format.
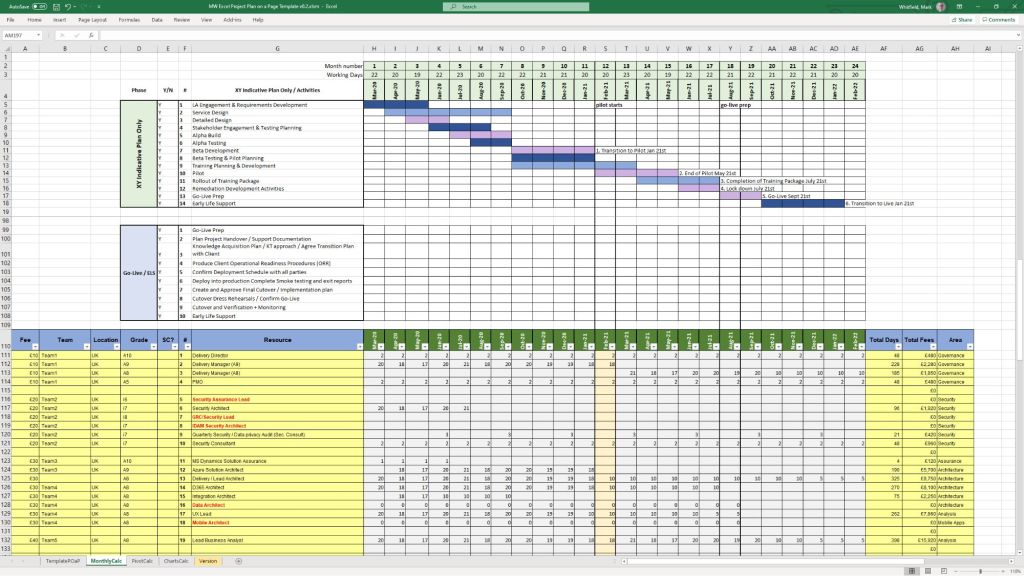
Project Plan on a Page Template (Excel): Tracks milestones and deliverables on a single sheet.
Waterfall Project Planner with Gantt View (Excel): Automates timeline bars and highlights dependency tracking.
Microsoft Project Plan Editable Templates (MPP / MSP): Implements native tracking with pre-populated project paths.
📊 2. Project Governance & Status Reporting
Built to manage the cadence of team communications, track risks, and report progress up to the PMO.
Weekly Status Report (PowerPoint): Provides standardized internal and external updates for Agile or Waterfall projects.
Status Report with PoaP, RAIDs, & Burn Down (Excel): Combines execution charts with high-level summary roadmaps.
MS Excel RAID Log: Acts as a central command log for Risks, Issues, Dependencies, and Change Requests (CRs).
⚖️ 3. Value & Benefits Realization
Ensures project delivery aligns with financial targets and baseline calculations.
Programme & Project Benefits Realization Tracker (Excel): Uses automated calculations and RAG status indicators to ensure value delivery.
Project Finance Tracker (Excel): Integrates budget forecasting against actual financial performance.
📦 4. Comprehensive Master Toolkits
Bundled suites that consolidate hundreds of micro-assets into standalone lifecycle frameworks.
200+ Project Management Templates Bundle (PDF/ZIP): Features customizable documents covering initialization through to closeout.
MS Teams Free Planner Guide: Details how to organize and execute Agile backlogs directly inside Microsoft Teams.
A detailed breakdown of the exact templates published by this author, structured by their functional use and file format, includes the following:
📈 PowerPoint (PPT / PPTX) Formats
Plan on a Page (POaP) Examples: A 39-slide PowerPoint document providing high-level visual roadmap templates to summarize project delivery tracks for executives.
Weekly Status Report (Internal / External): A 15-slide PowerPoint designed for recurring project health reporting, configured for both Agile and Waterfall methodologies.
📊 Excel (XLS / XLSX) Formats
Waterfall Project Planner: A structured spreadsheet featuring built-in, automated Gantt view generation tools for scheduling sequential project stages.
Status Report with Plan on a Page & RAIDs: A hybrid workbook integrating high-level timelines, a Risk, Assumptions, Issues, and Dependencies (RAID) log, and an Agile burn-down chart tracker.
PRINCE2 Editable Planning & Cost Tracker: A financial tracking sheet customized specifically to align with the stage-gate requirements of the PRINCE2 methodology.
🛠️ Microsoft Project (MPP) Formats
Microsoft Project Plan Template: A baseline editable project plan native schedule built for resource loading and critical path tracking.
PRINCE2 Microsoft Project Plan: A pre-configured schedule mapped directly to standard PRINCE2 product breakdowns and stages.
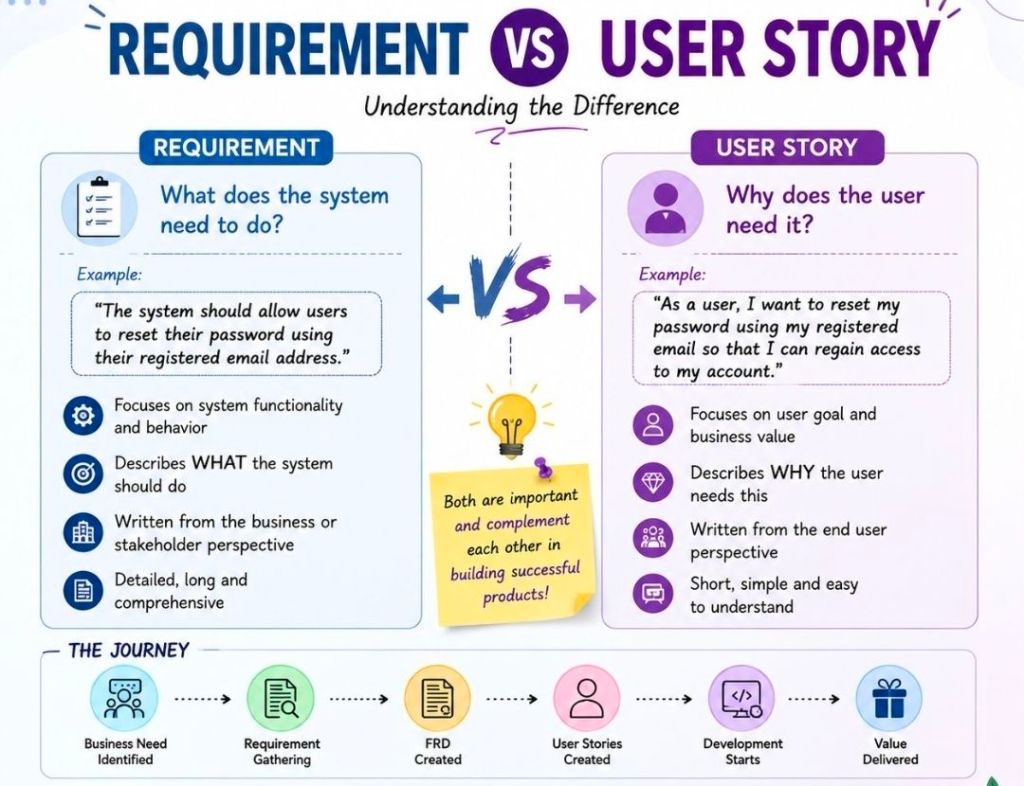
Project requirements are comprehensive, formal specifications describing what a system must do, usually written from the system’s perspective. User stories are short, lightweight descriptions of functionality written from the end-user’s perspective to drive team collaboration and conversation.
The distinction between these two approaches shapes how modern development teams capture scope and value.
Requirement versus User Story
Understanding Project Requirements
Focus: System functionality, technical constraints, and business rules.
Perspective: Written from the viewpoint of the system or product (e.g., “The system shall generate daily PDF reports.”).
Format: Heavy documentation, PRDs (Product Requirements Documents), spreadsheets, or flowcharts.
Methodology: Traditionally used in waterfall methodologies to define the scope comprehensively before any design or development begins.
Understanding User Stories
Focus: The user’s goal, business value, and the “why” behind a feature.
Perspective: Written from the viewpoint of the persona using the system (e.g., “As a Sales Manager, I want to review daily signups so that I can prioritize my sales calls.”).
Format: Short, often using the template: As a [User], I want to [Action], so that [Benefit]. Accompanied by Acceptance Criteria.
Methodology: An Agile-first tool. They are designed to act as an “invitation to a conversation” rather than a finalized contract.
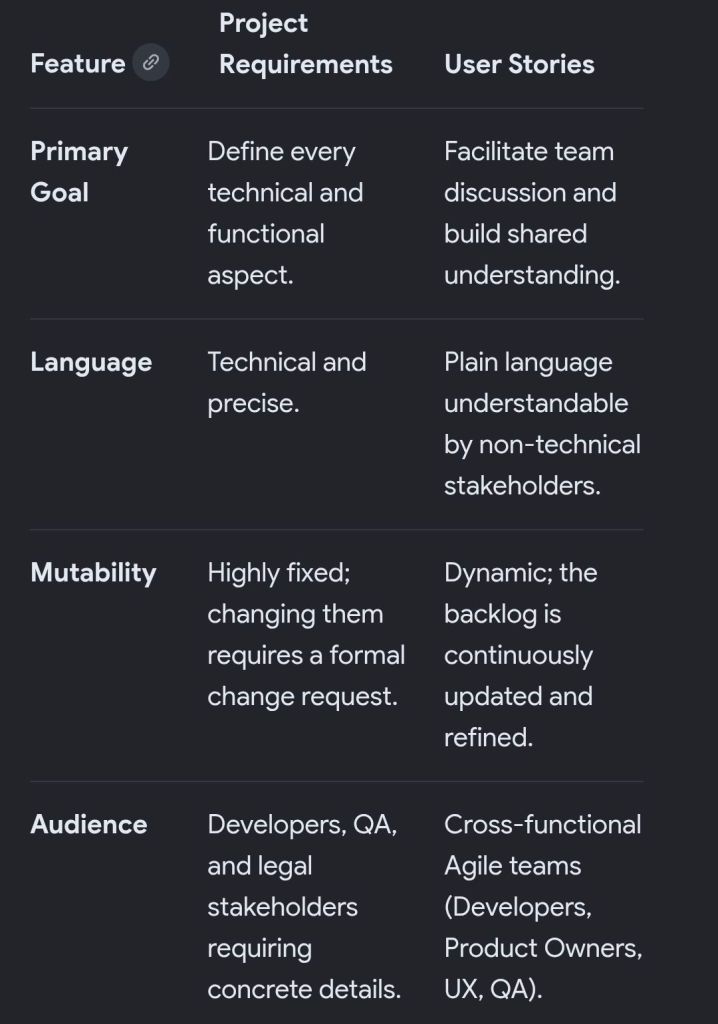
Key Differences at a Glance
How They Work Together (The Hybrid Approach)
Most modern software development teams don’t abandon requirements entirely, but they shift the format. They use lightweight User Stories to represent the core value, and then pair them with technical Acceptance Criteria or supplementary design specifications to clarify the exact requirements the system must satisfy.
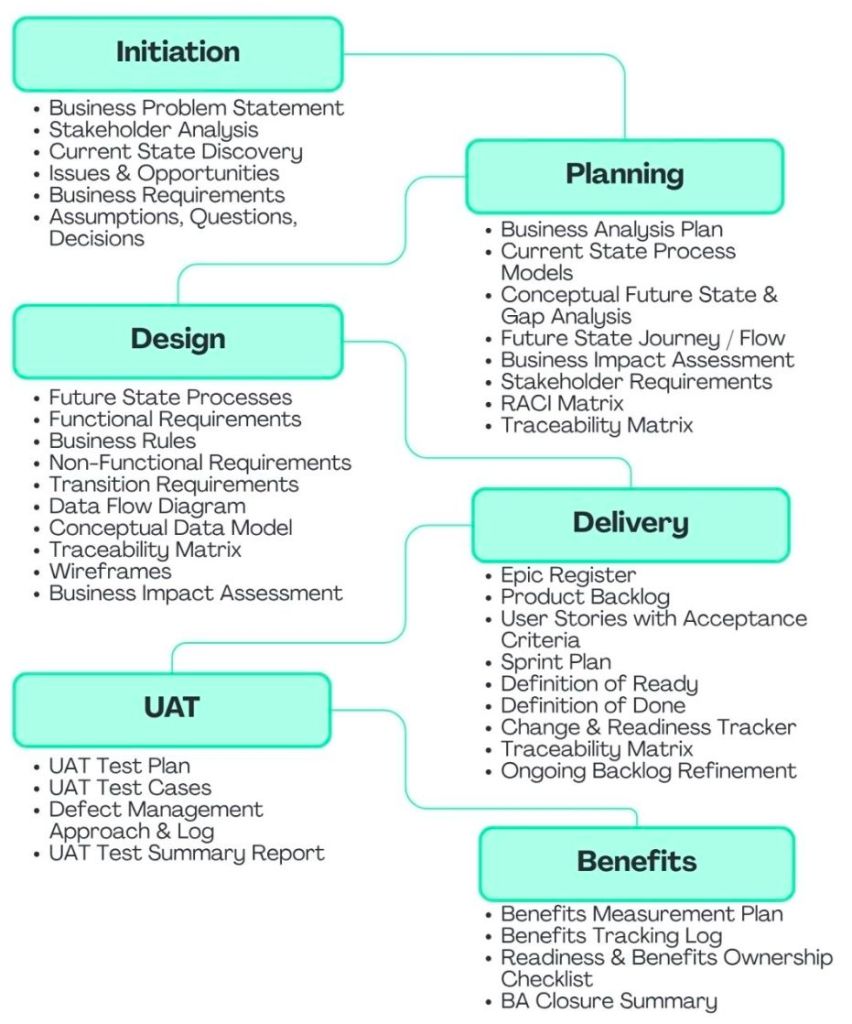
In the project planning phase, a Business Analyst (BA) focuses on establishing the project’s strategic alignment, defining the baseline scope, mapping stakeholders, and structuring the business analysis methodology.
The critical BA deliverables generated during this phase ensure clarity and alignment across technical and business teams before execution begins.
Strategic & Scope Foundations
Business Problem Statement: Defines the core issue being addressed, why it matters to the organisation, and the downstream impact if no action is taken.
Business Case: Outlines the shortlisted, viable operational choices alongside a comprehensive cost-benefit analysis to justify financial investment.
Project Vision & Scope: A high-level description outlining system boundaries, project objectives, and structural constraints to prevent eventual scope creep.
Stakeholder & Communication Frameworks
Stakeholder Map: Visually identifies all internal and external parties who are involved in, impacted by, or influential to the initiative.
Stakeholder Analysis Matrix: Assesses stakeholder interest and decision-making power to customize communication and engagement strategies.
Business Glossary: A standardized registry defining critical business terminology to maintain consistent vocabulary across different teams.
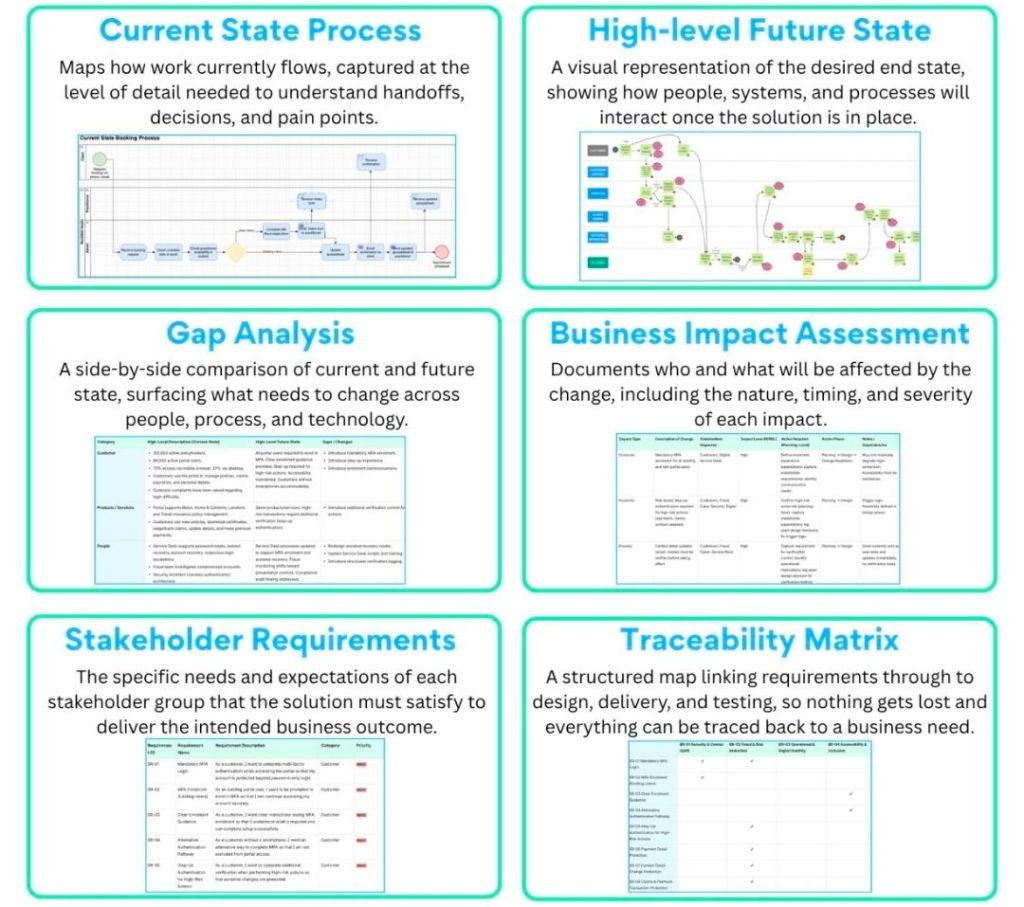
Process & Data Models
Current State Discovery (“As-Is” Models): A structured overview detailing exactly how today’s workflows, processes, and operating models currently function.
High-Level Context Diagram: Maps the structural boundaries of the proposed project, showing how the internal system will interact with external users and data systems.
Data Flow Diagram (DFD): Illustrates how information travels visually across different processes, storage points, actors, and functional areas.
BA Execution Planning
Business Analysis Approach: Outlines the core delivery methodology (e.g., Predictive/Waterfall or Adaptive/Agile), specifying the timelines, techniques, and governance processes to be used.
Requirements Management Plan: Defines the tools for managing requirements, access protocols, configuration control, and how changes to the baseline will be systematically approved.
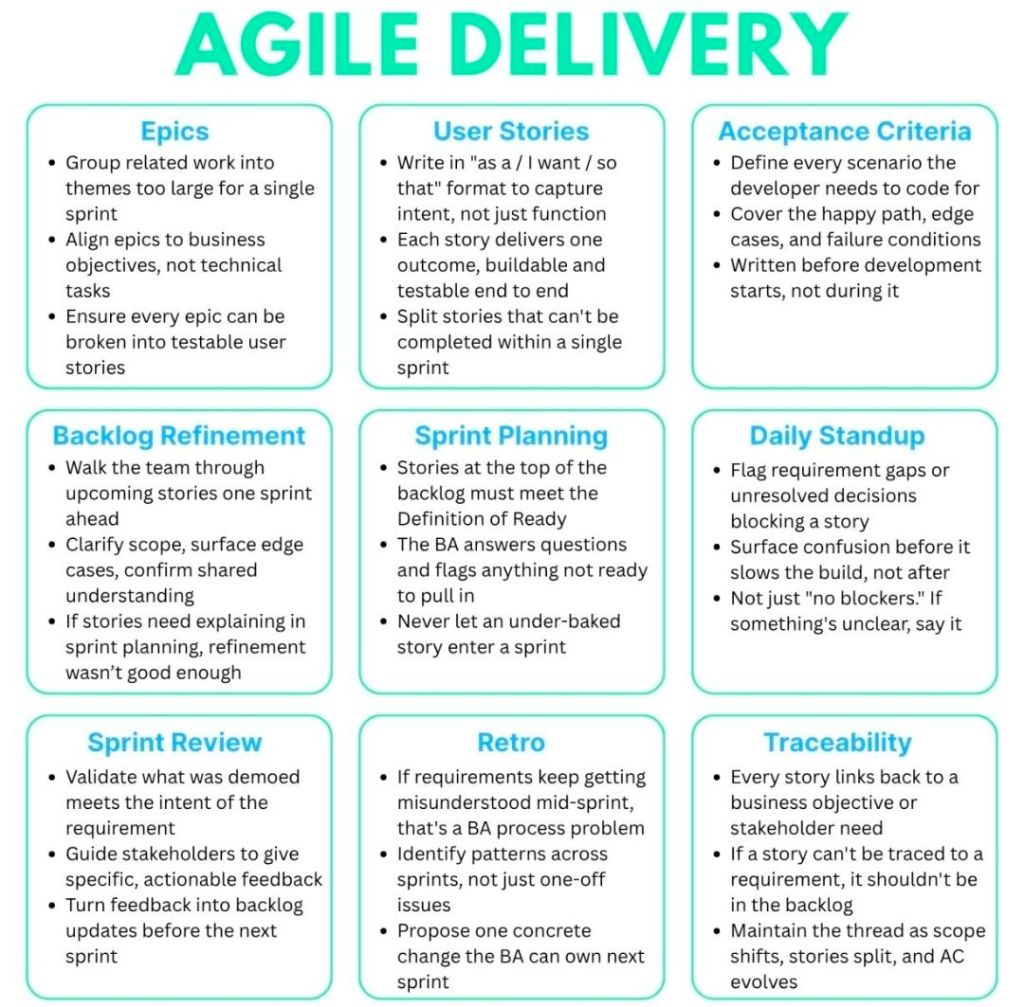
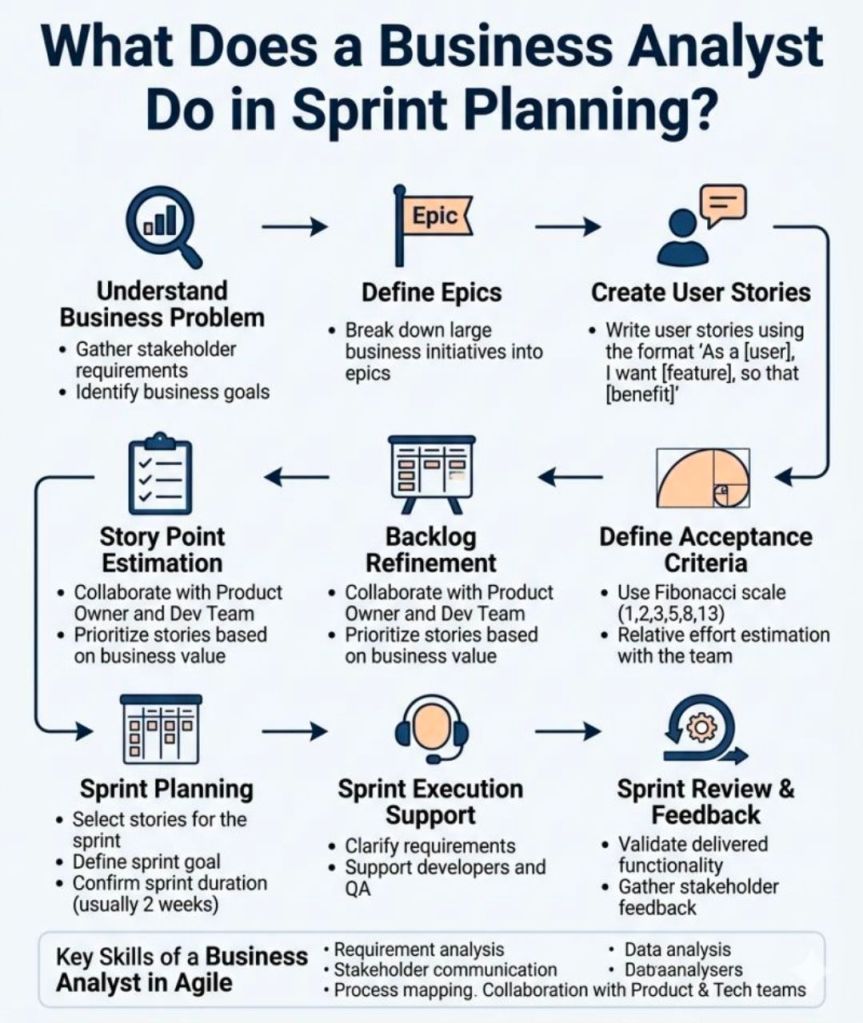
In Agile and Scrum frameworks, the Business Analyst (BA) bridges the gap between high-level business vision and tactical development execution. During Sprint Planning, a BA’s primary focus is to ensure that the development team has absolute requirement clarity, eliminating assumptions before a single line of code is written.
The exact focus areas of an Agile Business Analyst are divided into pre-planning readiness, active session support, and look-ahead risk management.
1. Requirements Readiness (Definition of Ready)
The primary pre-planning objective for a BA is ensuring that the top of the Product Backlog satisfies the team’s “Definition of Ready” (DoR).
INVEST Criteria: Verifying that each Product Backlog Item (PBI) is Independent, Negotiable, Valuable, Estimable, Small, and Testable.
Acceptance Criteria: Drafting robust, edge-case-tested functional parameters (often using the Given-When-Then format) to govern testing.
Business Rules & Models: Mapping complex data models, workflows, and process rules so developers have clear visuals alongside text.
2. Guarding the Business Value and Sprint Goal
While the Product Owner (PO) sets the priority, the BA confirms that the selected sprint backlog items align logically to form a cohesive target.
Sprint Goal Formulation: Supporting the PO in defining a functional, clear objective for the iteration rather than a random collection of tickets.
Value Justification: Serving as the “voice of the user,” reminding the technical team why a feature is being built and how it affects the end-user journey.
3. Technical and Functional Bridging
During the actual planning meeting, developers break down stories into sub-tasks and estimate effort. The BA provides live context.
Assumption Removal: Answering immediate clarifications regarding data constraints, legacy dependencies, or UI expectations.
Sizing Support: Assisting the team during story-point estimation by highlighting hidden functional complexities that impact effort.
Scope Trimming: Helping break down massive User Stories (Epics) into bite-sized, single-sprint tasks if an item is deemed too large.
4. Dependency and Risk Mitigation
A critical focus for the BA is ensuring the upcoming sprint does not get blocked by outside factors.
Cross-Team Alignment: Identifying if a story relies on an API or data feed managed by an external team, ensuring those pieces are unblocked.
Non-Functional Requirements (NFRs): Catching frequently missed parameters, such as specific security protocols, compliance standards, or localization requirements, before work kicks off.
ProjectTemplatesSoft on Etsy is a highly rated, UK-based digital storefront specializing in professional-grade project management spreadsheets and presentation documents. Founded by Mark Whitfield, a veteran Senior Project Manager with over 30 years of delivery experience in IT and the Software Development Lifecycle (SDLC), the shop bridge the gap between heavy enterprise software and simple, flexible spreadsheets.
Example POaP PPT and XLS plan project templates (200+ in all)
The products are distinctively built around core professional methodologies including PRINCE2 Waterfall and Agile Scrum frameworks. A key differentiator for this storefront is its customer lifetime model: all template upgrades and functional versions are 100% free after a single purchase by contacting the seller directly. The tools are fully unlocked, editable, and act as a portable alternative for teams or clients without expensive Microsoft Project licensing.
Product Breakdown by Category Focus
📊 1. Schedule Planning & Waterfall Templates
These tools target timeline generation, resource distribution, and critical path management for traditional structured delivery.
Waterfall Project Planner & Cost Tracker: An advanced interactive timeline engine that acts as a localized alternative to MS Project. It allows teams to map out milestones while calculating live run-rate expenditures.
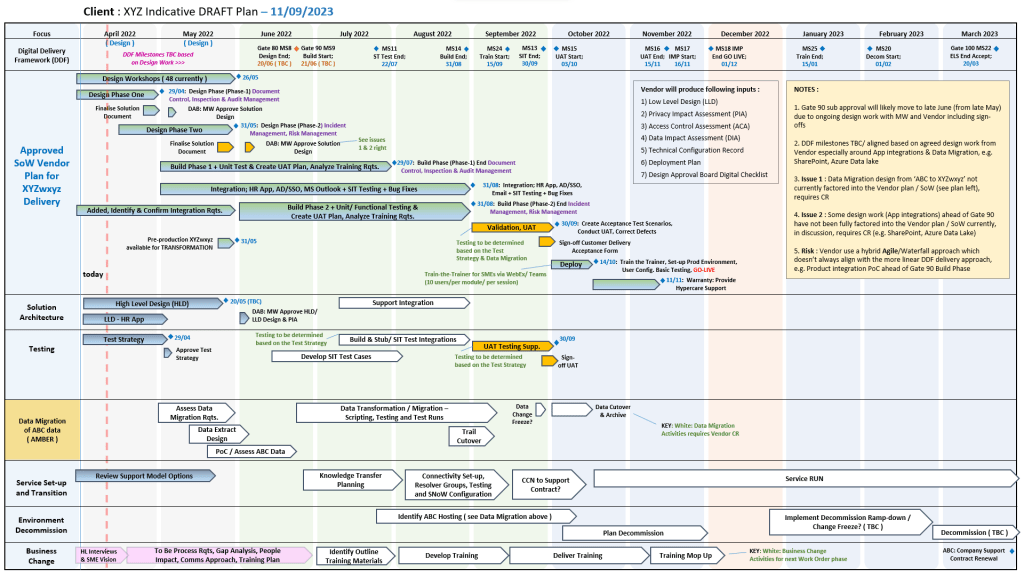
Plan on a Page (POaP) Blueprint: A high-level stakeholder alignment presentation tool crafted in Microsoft Excel and PowerPoint designed to condense multi-layered delivery milestones into one scannable executive slide.
Work Breakdown Structure (WBS) Matrix: Structural templates built to parse complex client scopes into manageable, sequential project tasks.
🔄 2. Agile & Scrum Framework Toolkits
Tailored for modern software development environments executing iterative design, rapid deployments, and sprint-based task management.
Agile Scrum Master Pack: Complete tracking logs optimizing sprint velocities, backlog grooming sessions, and team capacity limits.
Built for Programme Management Offices requiring cross-project transparency, strict risk mitigation, and central staff scheduling.
Central RAID Log: A classic, comprehensive spreadsheet designed to track project Risks, Assumptions, Issues, and Dependencies under strict corporate governance standards.
Resource Absence & Sickness Tracker: A centralized planner for operations managers to log annual leave, sickness intervals, and alternative project allocations.
Project Team Kick-Off Decks: Professionally designed slide blueprints that outline scope definitions, stakeholder communication channels, and milestone objectives during initiation phases.
Essential Shop & Resource Hyperlinks
To explore the complete range of toolkits, check out the official ProjectTemplatesSoft Etsy Shop Page.
To access detailed execution frameworks, read customer documentation, or seek professional delivery guidance, visit the developer’s hub at Mark Whitfield’s Project Management Blog.
Mark Whitfield’s Project Management (PM) methodology relies on over 200 editable templates tailored for both Agile Scrum and Waterfall / PRINCE2 frameworks. Developed over 24 years of IT and digital delivery, the toolkit focuses on high-level reporting, rigorous risk control, and visual tracking to align teams with corporate governance.
An example of many Plan On a Page (POAP) templates
Templates by Category and Methodology
1. Detailed Planning & Scheduling
Methodology: Mapped to the Software Development Life Cycle (SDLC) for both sequential Waterfall phases and iterative Agile sprints.
Templates:
Microsoft Project (MPP): Fully loaded schedules detailing project inception, elaboration, construction, and transition.
Excel Detailed Plans: Work Breakdown Structure (WBS) mapped to sequential and date-driven task management with built-in RAG (Red/Amber/Green) status indicators.
2. Visual Reporting & Execution (Plan on a Page)
Methodology: Focuses on structural, executive communication to prevent scope creep and keep stakeholders aligned.
Templates:
POaP (Plan on a Page): High-level visual summaries designed for client presentations and quick-glance milestone tracking in Excel and PowerPoint.
Burn-up / Burn-down Charts: Visual tracking metrics used in Agile Sprints to show progress towards delivery goals.
3. Risk & Governance Control
Methodology: Built on strict risk/action tracking and regular lessons learned to manage uncertainty throughout the project lifecycle.
Change Requests/Decisions Log: Supplementary tabs within the RAID register to strictly manage scope changes and project governance.
4. Financial Trackers
Methodology: Ensures project adherence to contracted margins, tracking both internal/external costs and resource efforts.
Templates:
Budget & Resource Trackers: Spreadsheets for forecasting versus actual expenses, variance calculations, expense reporting, and margin tracking with pivot-table readiness.
5. Team RACI & Status Reporting
Methodology: Clearly defines stakeholder roles and communication frequencies (weekly/monthly) to ensure continuous monitoring and control.
Templates:
RACI Matrix: A mapping tool defining who is Responsible, Accountable, Consulted, and Informed.
Weekly Status Reports: Word/Excel templates detailing internal and external project health, current milestones, and upcoming sprints.
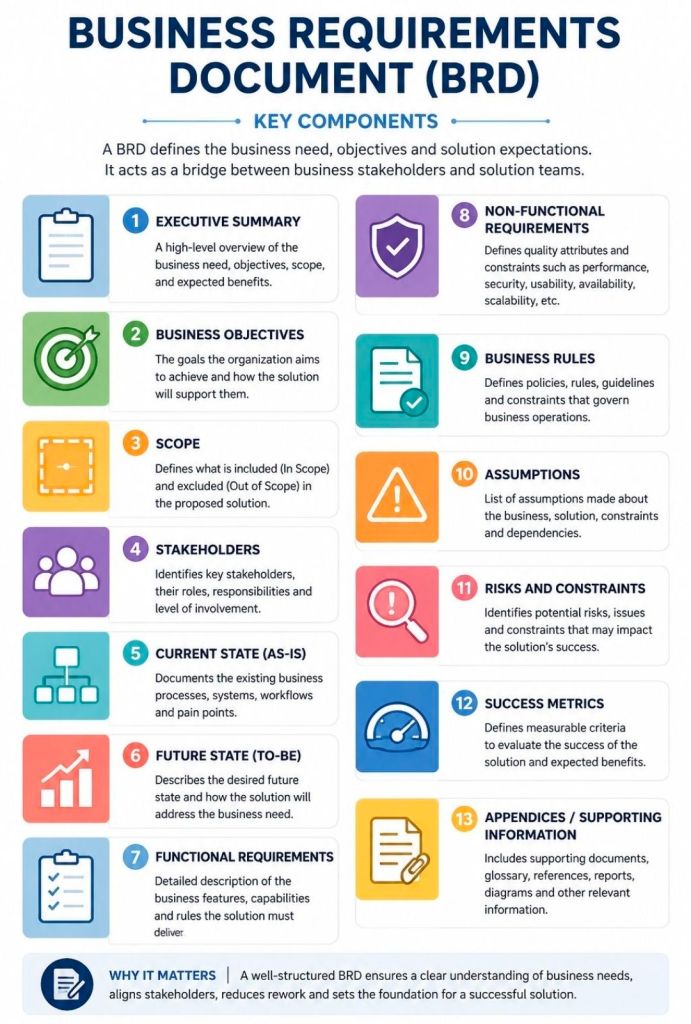
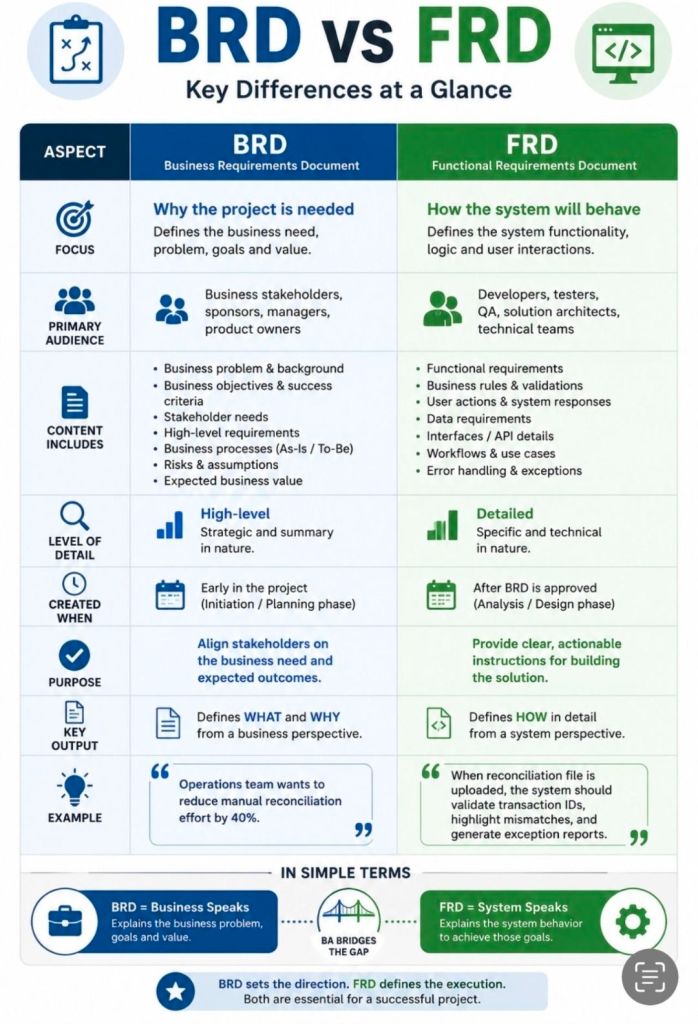
A Business Requirements Document (BRD) details what a project must accomplish and why it matters to the organization, acting as a bridge between business stakeholders and technical execution teams.
Here is a summary of the core sections required to construct a comprehensive BRD:
1. Document Control
Version History: Tracks changes, authors, and dates to ensure everyone uses the current iteration.
Approvals: Formal sign-off section where stakeholders authorize moving the project forward.
2. Executive Summary
Project Overview: A brief one-page overview stating the essence and main purpose of the project.
Needs Statement: Outlines the core business challenges or opportunities the project solves.
3. Project Scope & Objectives
Project Objectives: High-level, measurable targets aligned with company goals, often using SMART criteria.
In-Scope: Clear boundaries stating exactly what deliverables or processes are included.
Out-of-Scope: Explicit list of features or tasks intentionally left out to prevent scope creep.
4. Stakeholder Analysis
Key Stakeholders: Identifies project sponsors, department heads, and end-users.
Roles & Responsibilities: Maps out who provides requirements, who reviews them, and who receives deliverables.
5. Process Specifications
Current State (AS-IS): Maps current operational workflows to illustrate existing bottlenecks.
Future State (TO-BE): Details the desired future process after implementing the solution.
6. Core Requirements
Business Requirements: The high-level operational goals and capabilities the system must offer.
Functional Requirements: Descriptions of specific system tasks or behaviours from a business user perspective.
Non-Functional Requirements: Standards for performance, system security, and scalability.
7. Financial & Strategic Analysis
Cost-Benefit Analysis: Compares estimated financial expenses against anticipated business gains.
Success Metrics: Defines Key Performance Indicators (KPIs) and expected Return on Investment (ROI).
8. Project Dynamics & Risk Management
Assumptions: Unverified elements assumed to be true for the project to progress.
Constraints: Fixed limitations such as budget, time, technology, or legal compliance.
Risks & Mitigation: Potential threats to project delivery paired with backup action plans.
Dependencies: External factors or other projects that this initiative relies on to succeed.
9. Supporting Documentation
Acceptance Criteria: The standards and conditions required for stakeholders to accept the final delivery.
Glossary: Clear definitions of industry terms and acronyms used throughout the document.
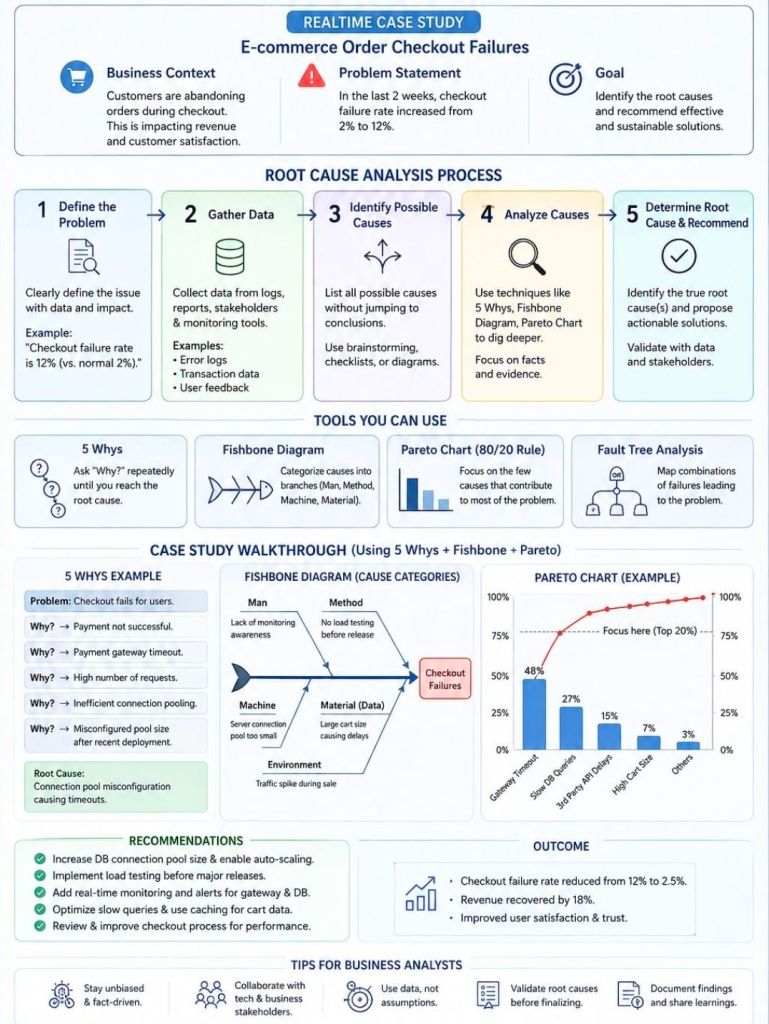
To perform a Root Cause Analysis (RCA) in IT, you must systematically isolate the underlying technical or process failure that caused an incident, rather than just treating the visible symptoms.
Following a structured IT service management framework ensures you fix the issue permanently and prevent it from happening again.
To perform a Root Cause Analysis (RCA) in IT
1. Define the Incident and Its Impact
Clearly articulate what went wrong using specific, technical terms. Avoid vague descriptions.
Draft a precise problem statement: Specify the exact error message, system component, and affected user base.
Quantify the impact: Note the financial cost, operational downtime, or number of disrupted transactions.
Establish containment: Ensure short-term workarounds are active to protect users while you investigate.
2. Gather Evidence and Timeline
Collect empirical data from your IT environment to reconstruct the exact order of events.
Pull system logs: Review application logs, server telemetry, database queries, and network traffic captures.
Check the change management registry: Cross-reference the exact time of failure against recent code deployments, infrastructure modifications, or patch updates.
Map out the sequence: Build a chronological timeline from the last known stable state to the moment of failure.
3. Identify Potential Causal Factors
Brainstorm all possible technical and human vectors that could have triggered the event.
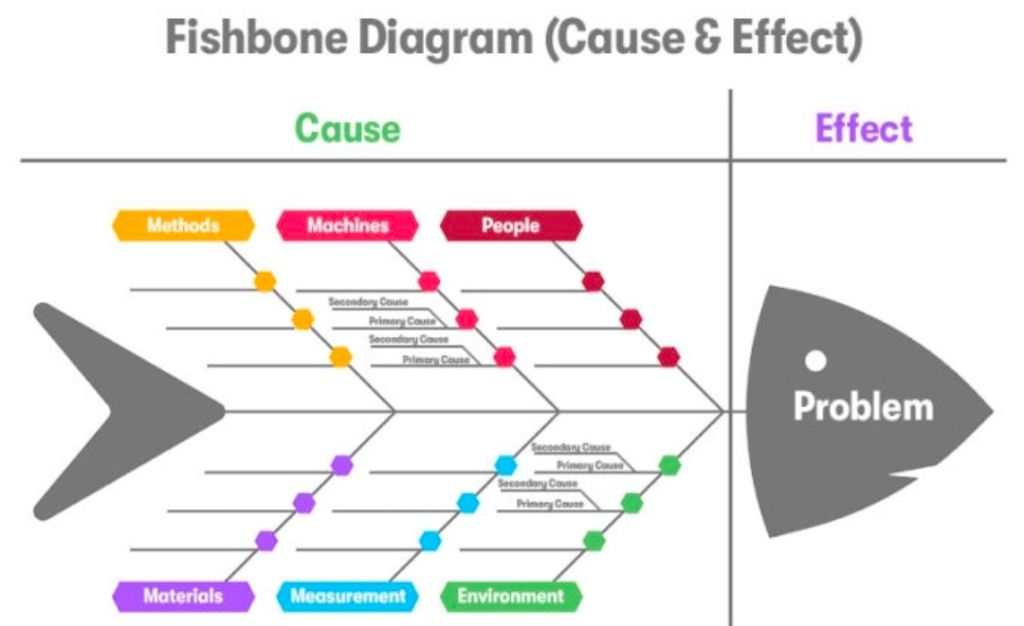
Brainstorm with a cross-functional team: Involve developers, system administrators, and network engineers to get different perspectives.
Categorize via Fishbone (Ishikawa) Diagrams: Separate potential culprits into categories like Code, Hardware, Processes, People, and Third-Party Vendors.
Categorize via Fishbone (Ishikawa) Diagrams
4. Isolate the Root Cause
Use deep analytical methods to narrow your broad list of potential causes down to the single source failure.
Apply the 5 Whys technique: Ask “Why?” repeatedly to drill past surface symptoms. For example:
Why did the application crash? The database ran out of memory.
Why did it run out of memory? A specific query caused a memory leak.
Why did the query leak memory? A recent code change did not close database connections.
Why were connections left open? The developer missed the disposal pattern in the new framework.
Why was it missed? There was no automated code linting or peer review rule for this framework (Root Cause).
Utilize Fault Tree Analysis (FTA): Use boolean logic to visually map how combinations of lower-level system faults lead to a high-level systemic failure.
5. Develop and Implement Preventive Solutions
Design a permanent fix targeting the root cause so the issue cannot happen again.
Deploy technical remediation: Patch code, reconfigure infrastructure, or scale resources.
Fix the process gap: Update documentation, add automated testing pipelines, or adjust alert thresholds.
Assign clear ownership: Appoint explicit owners and deadlines for each action item.
6. Document and Practice Blameless Reviews
Foster transparency to improve future infrastructure resilience.
Conduct a blameless post-mortem: Focus entirely on how the system allowed the failure to occur, not who made the mistake.
Publish an internal RCA report: Document the timeline, data points, root cause, and remediation steps in a searchable knowledge base.
For a visual breakdown of how to execute these problem-solving techniques in practice, watch this tutorial on conducting a root cause analysis:
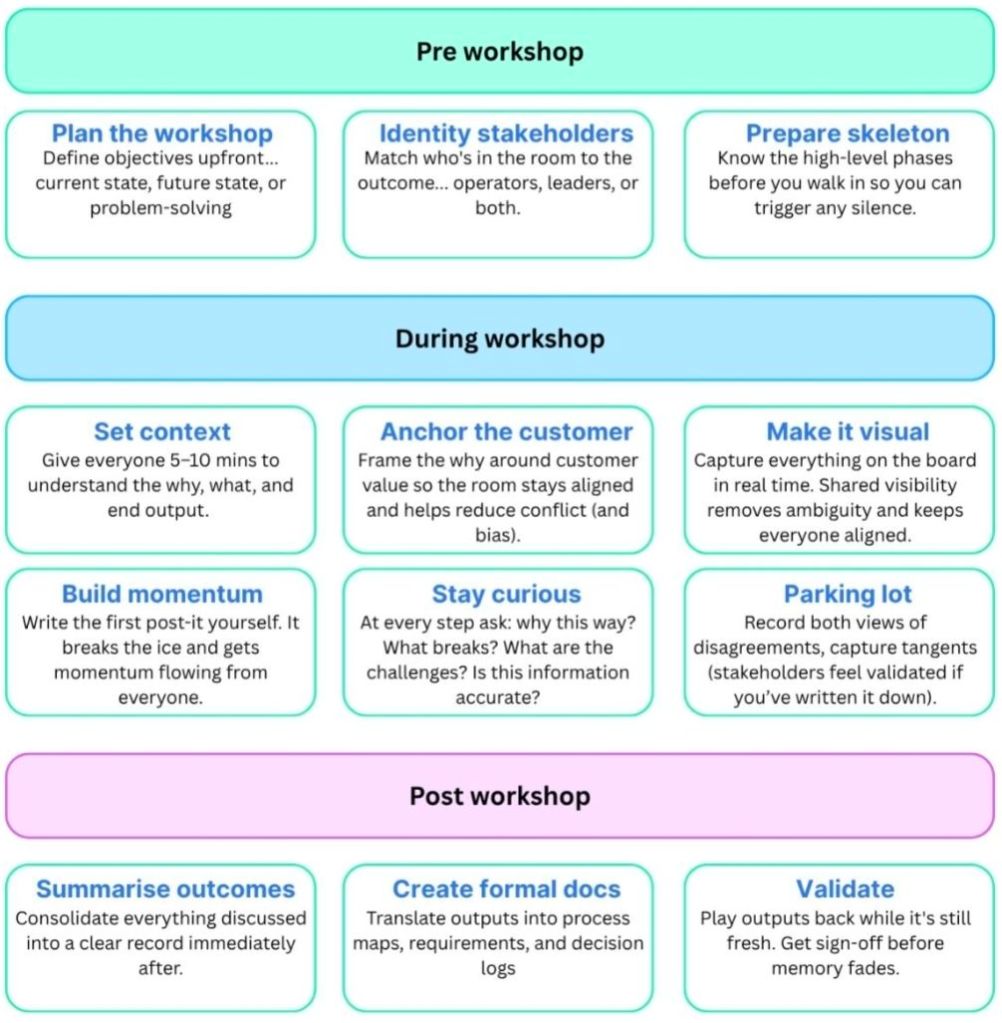
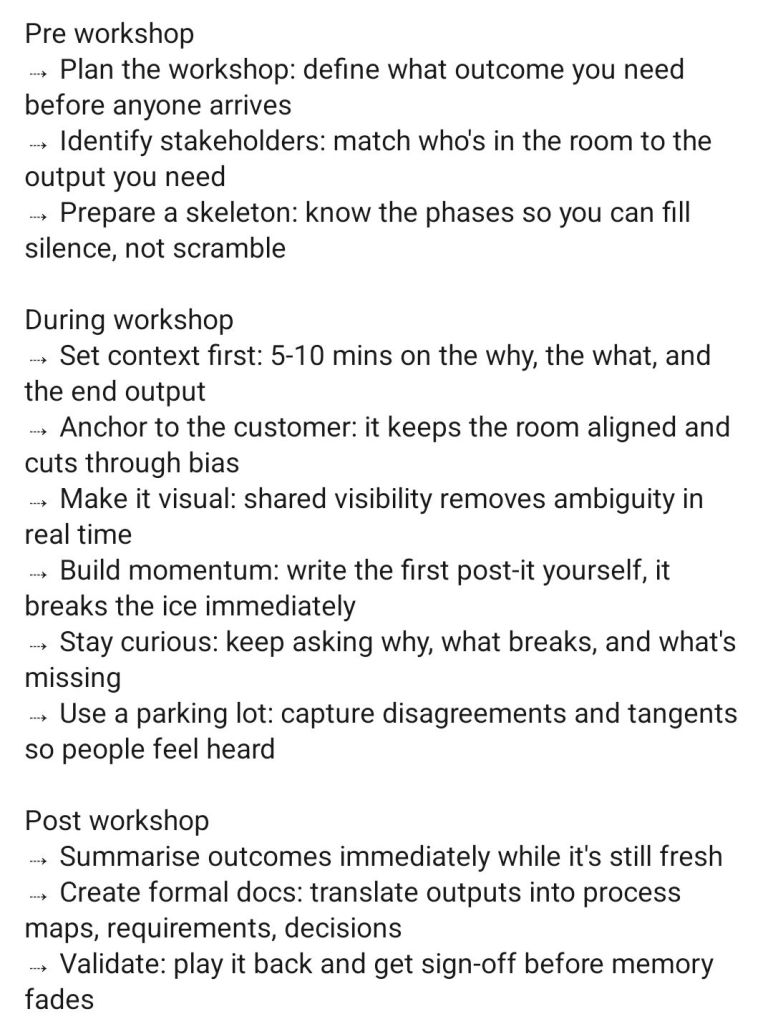
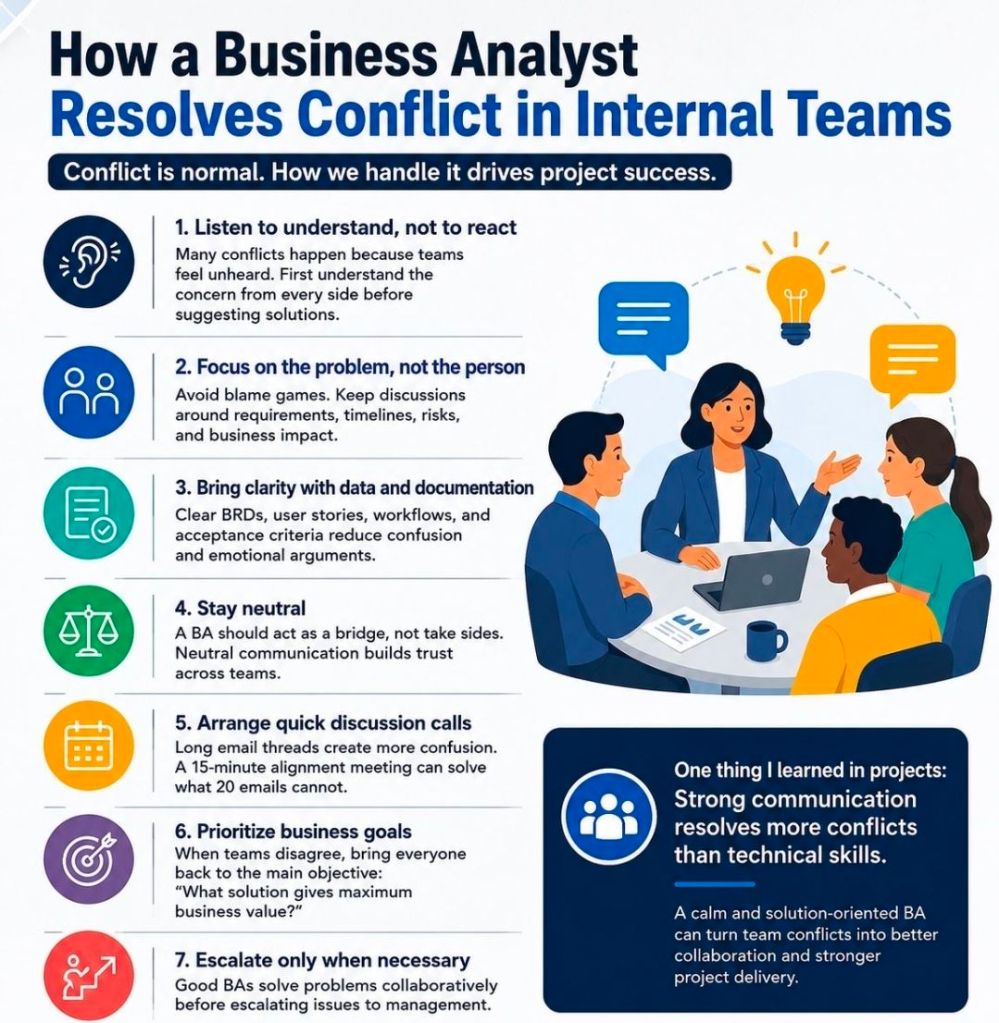
As a Business Analyst (BA), facilitating workshops is a core competency used to elicit requirements, align cross-functional teams, and achieve stakeholder consensus. Success hinges on meticulous pre-session planning, active moderation of group dynamics during the session, and timely post-workshop documentation.
A proven framework for facilitating impactful BA workshops involves three critical phases:
1. Preparation
Planning is the most important step for a successful workshop. Poorly planned sessions waste valuable stakeholder time.
Define the Objective: Identify exactly what needs to be achieved (e.g., process mapping, feature prioritization, or user story mapping).
Select Participants: Invite subject matter experts (SMEs), decision-makers, and end-users. Keep the group size manageable, usually between 5 to 10 people to ensure productivity.
Create a Clear Agenda: Break the time down into specific activities. Allocate time for introductions, the core activity, breaks (if >1 hour), and a summary.
Prepare Materials: Set up whiteboards (physical or digital like Miro/Mural) and prepare your facilitation techniques (e.g., brainstorming, MoSCoW prioritization).
2. Execution (In the Session)
Your role is to act as a neutral guide, keeping the team focused on the objective rather than getting bogged down in implementation details.
Set Ground Rules: Establish parameters early, such as one conversation at a time, keeping devices put away, and respecting everyone’s input.
Manage Group Dynamics: Encourage quieter participants to speak up while politely reigning in dominant voices.
Use a ‘Parking Lot’: Create a designated section on a whiteboard for off-topic ideas, out-of-scope concerns, or unresolved questions to prevent the meeting from derailing.
Visual Collaboration: Use process flows, mockups, or sticky notes to give the conversation a focal point. This triggers ideas and helps maintain stakeholder attention.
3. Post-Workshop
The work doesn’t end when the meeting concludes. You must synthesize the information gathered to ensure it translates into actionable project deliverables.
Consolidate Documentation: Clean up notes, digitize whiteboard sessions, and format the elicited requirements.
Distribute and Align: Send a clear, written summary to participants outlining decisions made, parking lot items that need resolution, and agreed-upon next steps (who is doing what and by when).
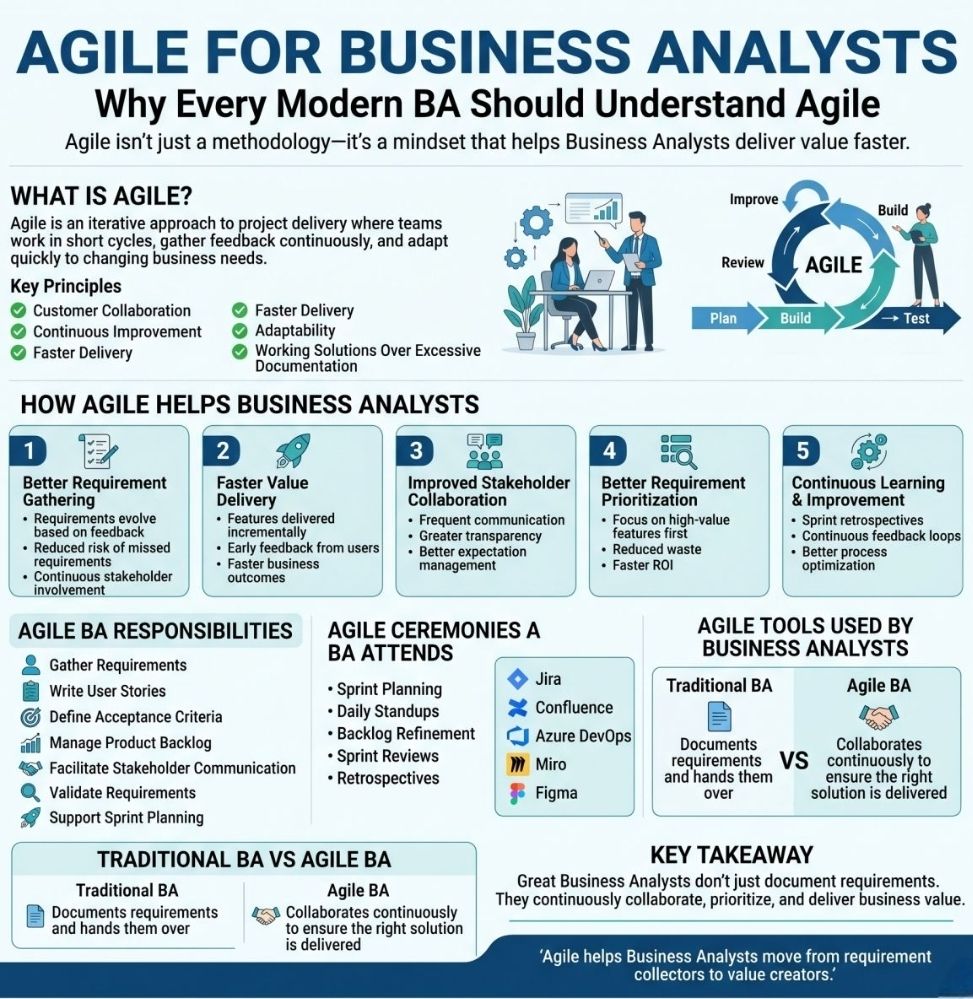
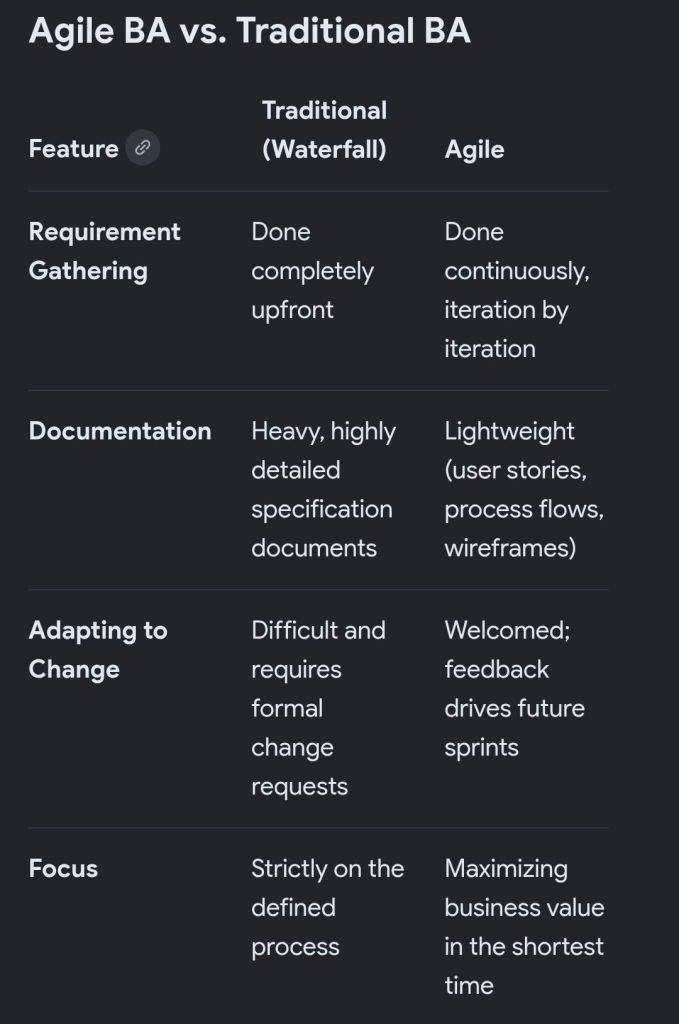
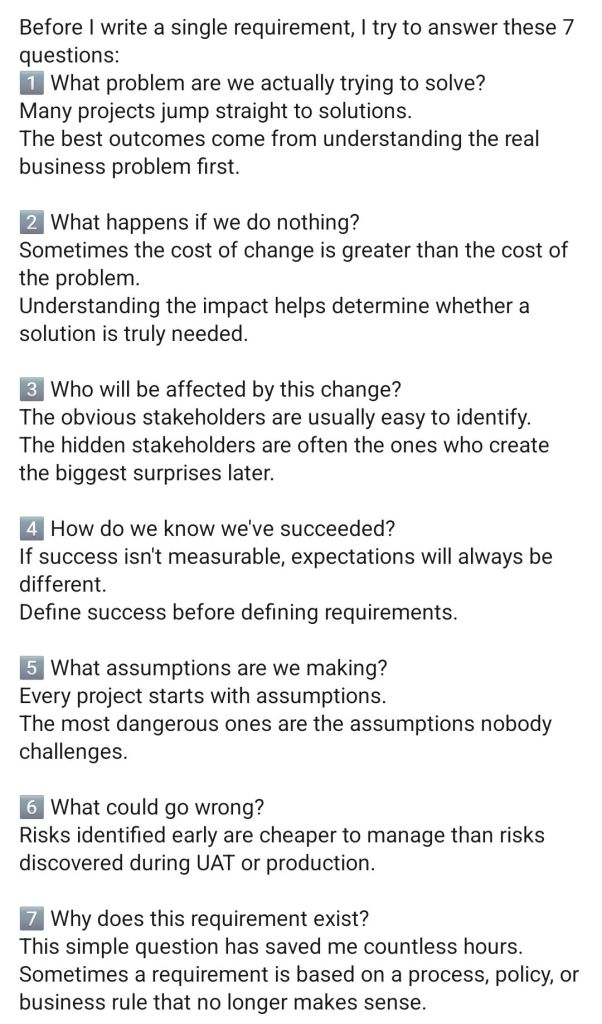
In an Agile environment, a Business Analyst (BA)acts as the crucial bridge between business stakeholders and the technical team. Rather than gathering all requirements upfront, Agile BAs focus on continuous analysis, delivering value in small increments, and writing lightweight user stories that adapt as the product evolves.
Transitioning from traditional (Waterfall) analysis to an Agile framework requires a fundamental shift in how requirements are handled, documented, and delivered.
The Core Shifts in an Agile BA Role
Continuous Discovery: Instead of producing a massive Requirements Document at the start, BAs analyze and refine requirements just-in-time and just-enough to keep the development team moving.
User Stories over BRDs: Traditional Business Requirements Documents (BRDs) are replaced with collaborative user stories and acceptance criteria.
Value-Driven Prioritization: The BA continuously helps the Product Owner (or acts as the Product Owner proxy) rank the Product Backlog so that the highest-value features are built first.
Shared Understanding: The focus is on face-to-face communication, workshops, and visual modeling (like wireframes) to ensure developers fully grasp what needs to be built.
Key Responsibilities
Agile BAs operate across several domains throughout the sprint lifecycle:
Backlog Refinement: Collaborating with stakeholders to break down large, complex requirements into smaller, manageable chunks (Epics to User Stories).
Definition of Ready (DoR): Ensuring that user stories are clear, testable, and have defined acceptance criteria before they are pulled into an active sprint.
Sprint Support: Answering questions from the development team in real-time, clarifying business rules, and helping to remove blockers.
Acceptance Testing: Assisting Quality Assurance (QA) teams or business users to validate that the delivered software works as intended and solves the underlying business problem.
Agile BA versus Traditional BA
Common Frameworks for Agile BAs
Scrum: Working alongside the Scrum Master, Product Owner, and Developers in short iterations (sprints), typically lasting 2 to 4 weeks.
Kanban: Managing a continuous flow of analysis work, prioritizing items on a visual board as development capacity allows.
AgileBA: A specific certification and framework designed by the Agile Business Consortium that provides BAs with practical tools for working in Agile settings.
Recommended Resources for Skill Building
To deepen your expertise in Agile business analysis, explore these highly regarded methodologies and guides:
Use the AgileBA Certification guide to understand official best practices.
Read the IIBA Agile Extension to the BABOK Guide for authoritative frameworks.
Review Bridging the Gap for practical, real-world implementation strategies.
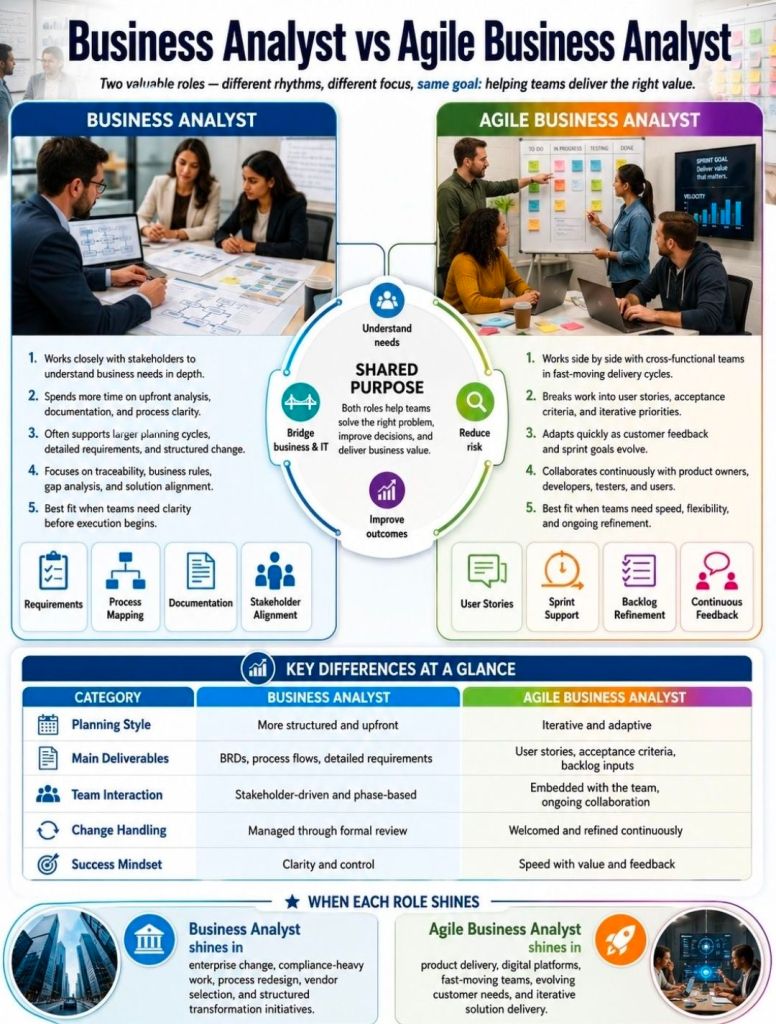
Requirements Traceability Matrix RTM & Business Analyst BA
A Requirements Traceability Matrix (RTM) is a structured project management document that links user and stakeholder requirements directly to their corresponding design elements, development deliverables, and verification test cases.
Acting as a living checklist throughout the project life cycle, its primary purpose is to ensure 100% test coverage, validate that all client requests are fulfilled, and prevent scope creep by identifying undocumented work.
The visual layout of a typical RTM template maps individual requirement rows against critical validation milestones.
🔄 Three Main Types of Traceability
The configuration of an RTM depends heavily on the direction of tracking needed for the project:
Forward Traceability: Tracks requirements forward into design, code, and test cases. It ensures the project executes every requested feature and that nothing gets left behind.
Backward (Backward-Looking) Traceability: Traces test cases and final deliverables back to the original requirement. It checks for scope creep, confirming that no extra, unauthorized features were added.
Bidirectional Traceability: Combines both approaches. It links requirements from origin to destination and vice versa, providing clear visibility during change management or troubleshooting.
📋 Structured Breakdown of RTM Content
A standard RTM is formatted as a multidimensional table. Below is the foundational structure, broken down into its logical data components:
1. Core Requirement Parameters
Requirement ID: A distinct alphanumeric identifier (e.g., REQ-001, BRD-102) for quick cross-referencing.
Requirement Type: Classifies the item (e.g., Business, Functional, Technical, UI, Security, or Regulatory Compliance).
Requirement Description: A concise textual explanation defining exactly what the feature or system must achieve.
Source/Origin: The document, stakeholder, client request, or meeting minutes where the requirement originated.
Priority Level: The urgency ranking of the item, usually categorized as High, Medium, or Low (or via MoSCoW ranking).
2. Design and Development Artifacts
Functional Specification ID: Links the requirement to the specific section of the functional design document.
Technical Design/Architecture Module: Points to the code packages, database tables, or system architectural components implementing the requirement.
3. Verification & Validation (Testing) Data
Test Case ID: The unique ID of the specific test cases designed to validate the feature (e.g., TC-101, TC-102).
Test Case Description/Objective: A snapshot of what the test case actually checks.
User Acceptance Testing (UAT) ID: Specific ID linking to end-user validation scenarios.
4. Execution & Quality Control Tracking
Test Execution Status: The real-time health indicator of the testing suite (e.g., Passed, Failed, Blocked, Not Run).
Defect/Bug ID: If a test fails, this column logs the active issue tracker ID (e.g., Jira ticket BUG-404) linked to the breakdown.
Current Deployment Status: Defines the project readiness stage (e.g., In Progress, Dev, QA, Production).
💡 Core Benefits of Maintaining an RTM
Prevents Missed Features: Verifies that every business requirement translates into clean code and valid testing cycles before software deployment.
Streamlines Change Management: If a client alters a feature, developers can quickly scan the RTM row to see exactly which code modules and test scripts need updates.
Simplifies Compliance Audits: Serves as regulatory proof in safety-critical landscapes (like medical devices or automotive software) that every target function passed validation.
Requirements Traceability Matrix RTM & Business Analyst BA
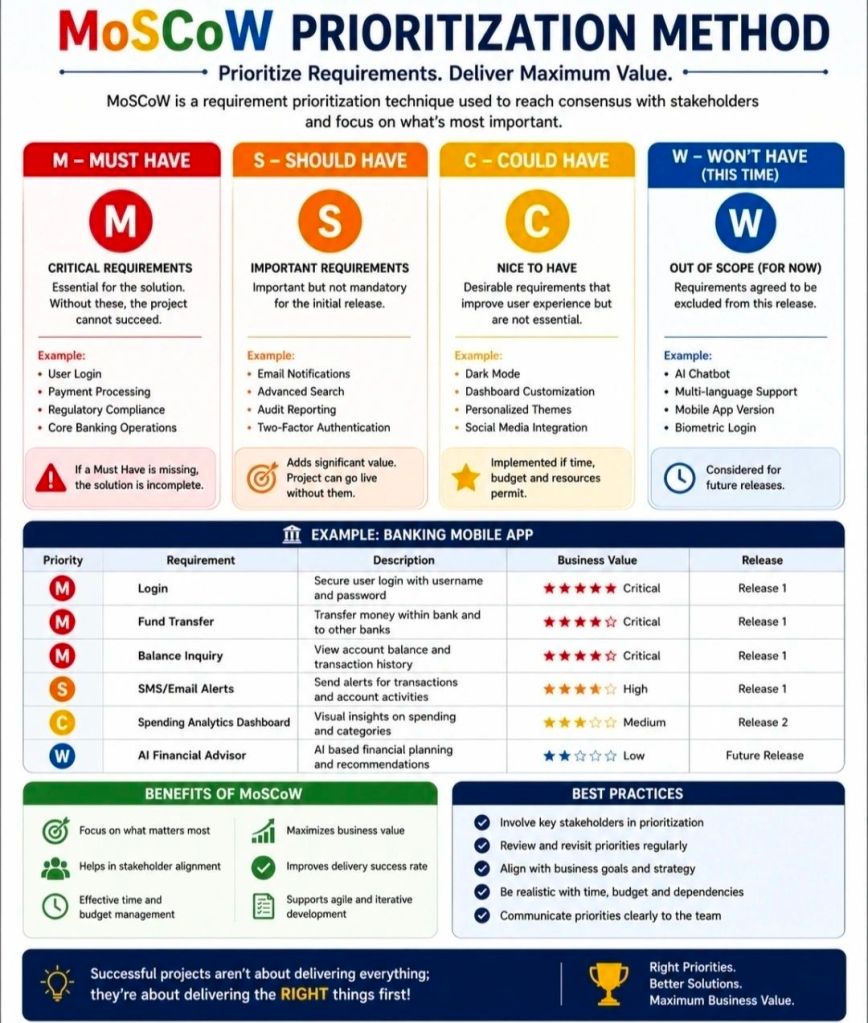
The MoSCoW method is a popular requirements prioritization technique used in project management and software development to help stakeholders reach a common understanding on the importance of deliverables. It categorizes tasks into Must, Should, Could, and Won’t have.
The MoSCoW Categories
Must Have: Non-negotiable requirements that are critical for success, compliance, or safety. Without these, the project is considered a failure and cannot be deployed.
Should Have: High-priority, important features that add significant value but are not strictly vital for immediate delivery. These are generally included if time permits, or they may have a manual workaround.
Could Have: Desirable, “nice-to-have” features that are small and easy to implement. These improve user experience but can be deferred or dropped without impacting the project’s overall success.
Won’t Have (or Won’t Have this time): Features that have been mutually agreed upon as out-of-scope for the current release or timeframe. They are deliberately excluded to prevent scope creep, though they may be added to the backlog for future cycles.
Why and When to Use It
Resource Management: It helps maximize limited time, budget, and resources by focusing effort on the features that provide the most immediate ROI.
Stakeholder Alignment: It acts as a negotiation tool, forcing stakeholders to agree on what is genuinely critical versus what is purely desirable.
Agile Environments: It is a foundational practice in Agile frameworks like DSDM, where teams adhere to fixed deadlines (timeboxes) and adjust the project scope instead.
Best Practices for Implementation
The 60-20-20 Rule: A common best practice is to ensure that Must Haves consume no more than 60% of the team’s total effort. Roughly 20% should be allocated to Should Haves, and 20% reserved for Could Haves to act as contingency room.
Challenge Assumptions: When classifying a requirement as a Must, ask: “What happens if we don’t do this? Can we still deploy the product?” If the project can still function—even awkwardly—it is likely a Should or Could.
Continuous Review: Priorities aren’t static. Re-evaluate your MoSCoW list at the end of every sprint or development cycle, as a Could Have from a previous phase might be upgraded or permanently discarded.
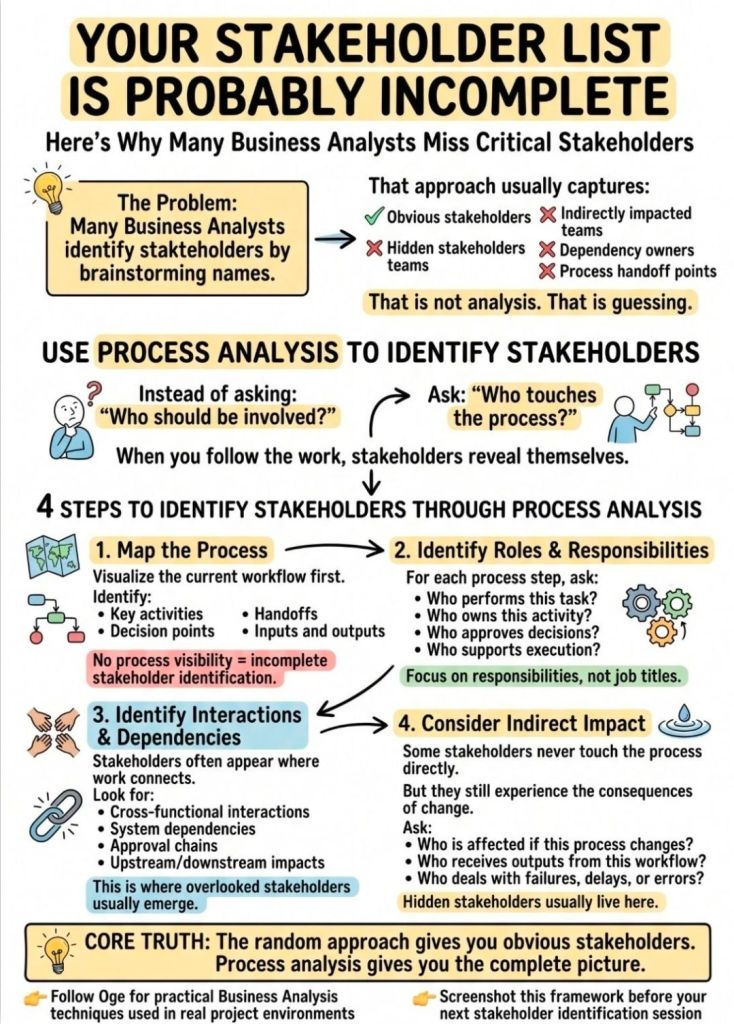
Completing the Stakeholder List using Process Analysis
Completing a stakeholder list using process analysis involves tracing the end-to-end lifecycle of a process to identify every individual, team, or organization that interacts with, influences, or is impacted by it. This ensures no hidden users, bottlenecks, or approvers are missed.
A four-step approach will ensure your list is thorough and actionable:
1. Map the Process Flow
Create a step-by-step flowchart of the current or future process. Break it down into key phases: Inputs, Activities, Outputs, and Outcomes. This visual map acts as a blueprint to spot every touchpoint where someone is involved.
2. Identify Stakeholders at Each Touchpoint
Go through each phase of your process map and ask the following dependency questions to pinpoint roles:
Input Stage: Who supplies the data, materials, or funding? (e.g., vendors, regulators, finance departments)
Activity Stage: Who performs the work or oversees it? (e.g., project teams, department managers, QA testers)
Output Stage: Who receives the final deliverable? (e.g., end-users, clients, customers)
Outcome Stage: Who is affected by the long-term results? (e.g., the community, executives, maintenance teams)
3. Classify and Prioritize
Once your comprehensive list is built, categorize stakeholders using the Power/Interest Matrix. This helps allocate your engagement efforts efficiently:
High Power, High Interest: Manage closely and collaborate heavily (e.g., Project Sponsors, Product Owners).
High Power, Low Interest: Keep satisfied but do not over-communicate (e.g., Regulators, Steering Committees).
Low Power, High Interest: Keep informed and consult regularly (e.g., End-users, Support Staff).
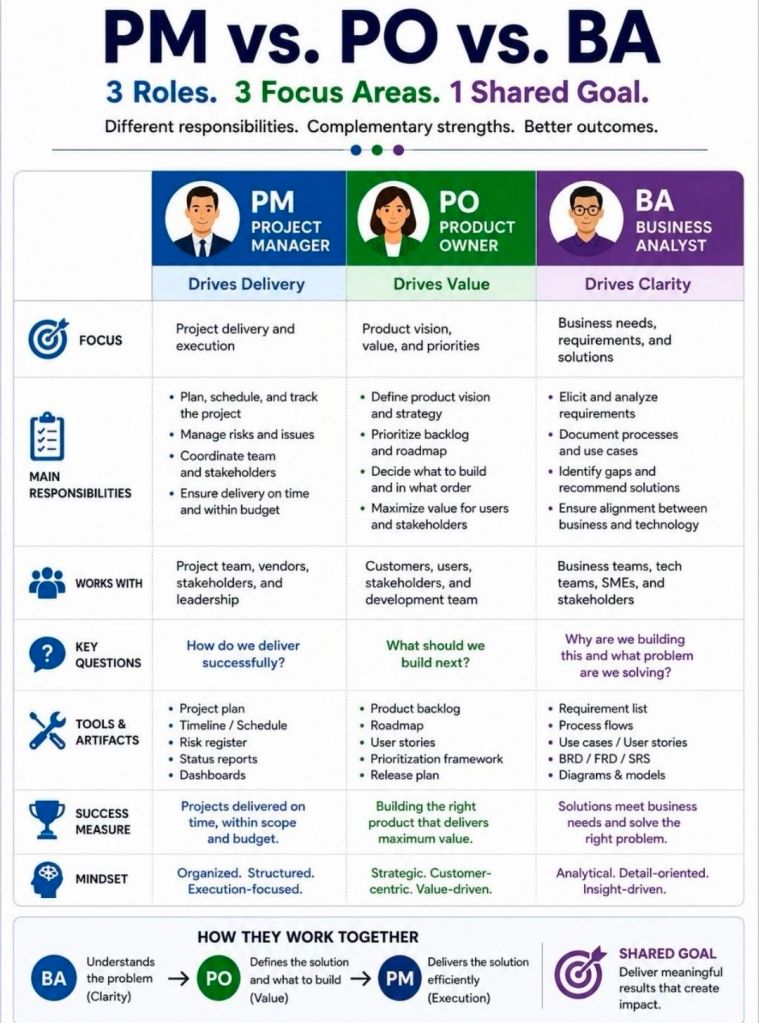
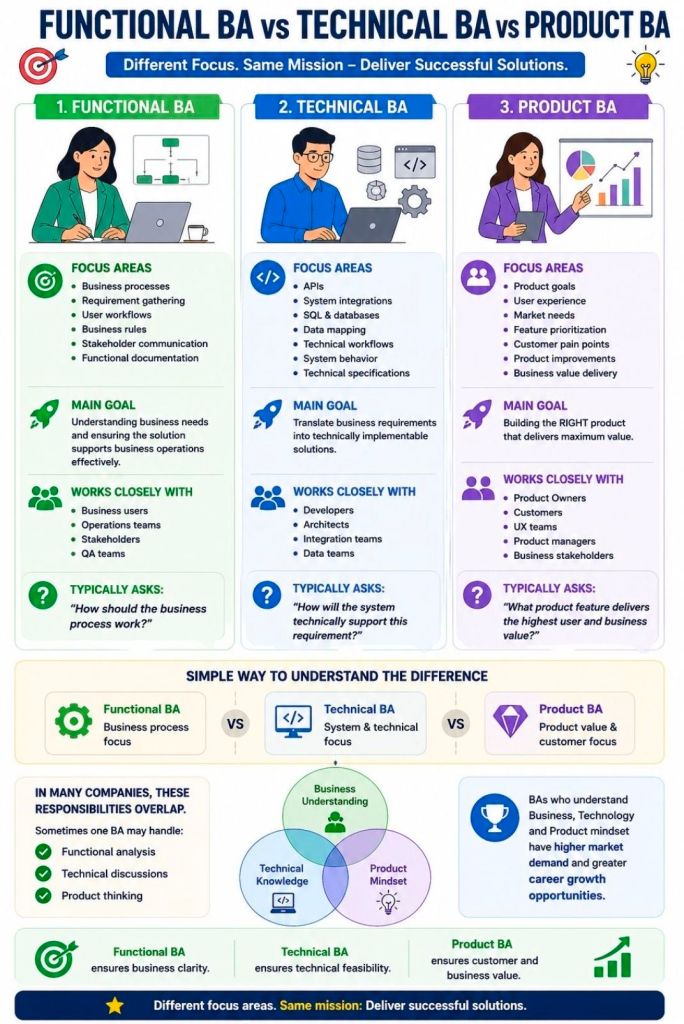
While all three roles fall under the “Business Analyst” umbrella, they differ in their primary focus: Functional BAs translate business needs into user requirements, Technical BAs focus on system architecture and integration, and Product BAs drive the product’s market value and long-term strategy.
1. Functional BA (The ‘Business’ Translator)
The Functional BA acts as the primary bridge between business stakeholders and the IT delivery team. They focus on what the business needs to achieve and how users will interact with the system.
Core Focus: Business processes, stakeholder communication, and end-user experience.
Day-to-day Responsibilities: Gathering requirements, mapping out user journeys, defining acceptance criteria, and creating process flow diagrams.
Key Skills: Stakeholder management, requirements elicitation, and deep domain knowledge (e.g., finance, healthcare).
2. Technical BA (The ‘System’ Architect)
The Technical BA bridges the gap between the functional requirements and the software development team. They focus on how the system will be built, ensuring the proposed solution is technically feasible, scalable, and secure.
Core Focus: System architecture, data flow, integrations, and non-functional requirements (like performance).
Day-to-day Responsibilities: Defining API structures, mapping data models, documenting system interfaces, and writing complex technical user stories.
Key Skills: Understanding of system integrations, database structures, basic coding logic, and system-to-system communication.
3. Product BA (The ‘Value’ Strategist)
The Product BA merges business analysis with product management principles. Rather than just fulfilling requested requirements, they focus on why a product or feature should be built, ensuring it aligns with overarching company goals and delivers tangible ROI.
Core Focus: Product strategy, feature prioritization, market viability, and user adoption.
Day-to-day Responsibilities: Conducting market research, managing the product backlog, defining Key Performance Indicators (KPIs), and analyzing user feedback/metrics.
Key Skills: Product discovery, data analysis, competitive analysis, and strategic roadmapping.
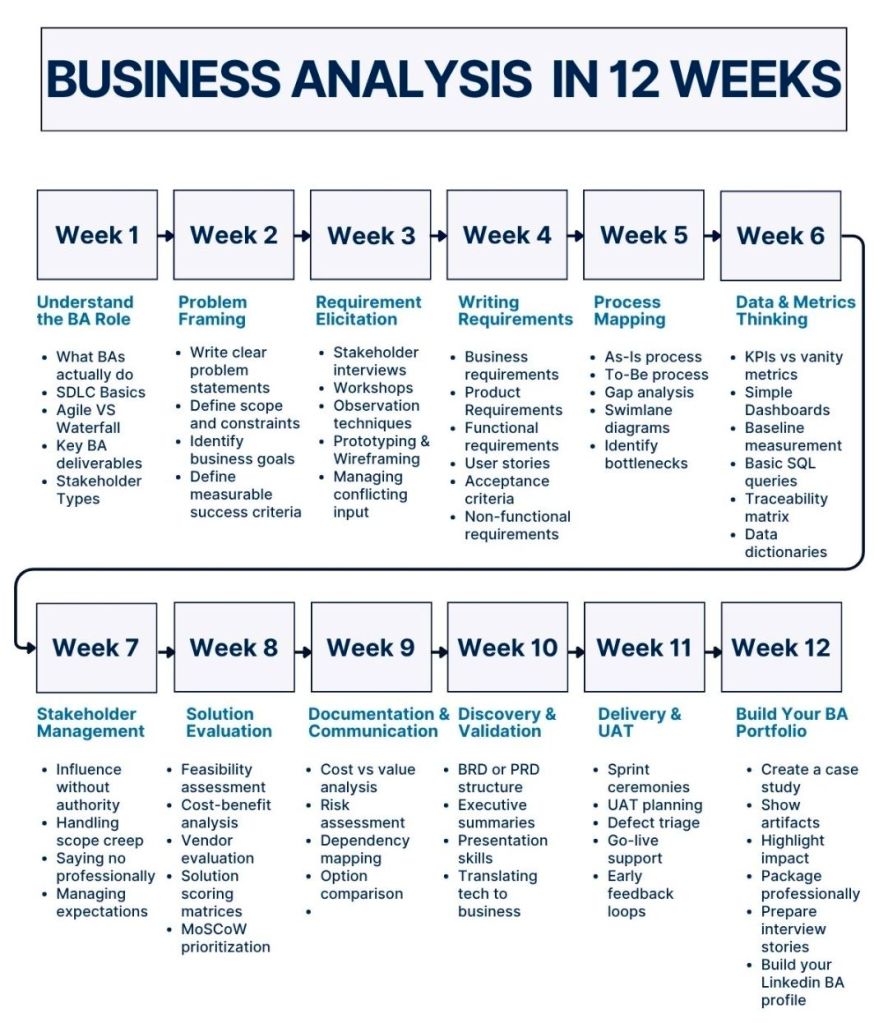
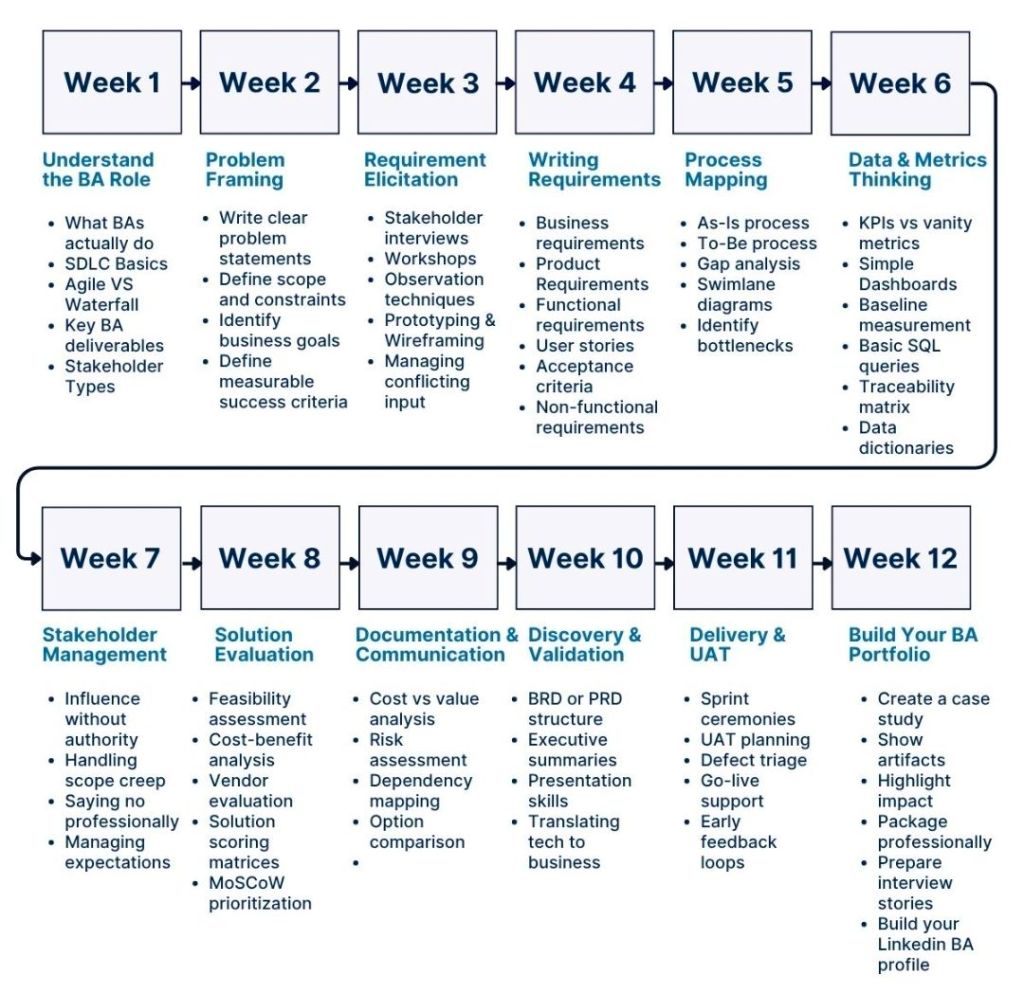
Business Analysis (BA) from week to week, across an example project
Another example;
Business Analysis (BA) across an example project—like building a custom mobile app—follows a dynamic, week-to-week lifecycle. It shifts focus from initial high-level strategy and stakeholder alignment to granular requirements, testing support, and post-launch evaluation.
Here is how a typical BA lifecycle breaks down across an example 8-week project timeline:
Week 1: Project Kickoff & Discovery
Focus: Understanding the business problem and setting boundaries.
Activities:
Facilitating kickoff workshops with key stakeholders.
Creating a Business Case or Vision Document to define the “why.”
Identifying key project sponsors, users, and subject matter experts (SMEs).
Week 2: Stakeholder Engagement & Elicitation
Focus: Extracting needs from the people who matter.
Activities:
Conducting interviews, surveys, and Focus Groups to gather initial wants and needs.
Mapping out high-level Business Processes (current “As-Is” workflows and future “To-Be” workflows).
Week 3: Analysis & Requirements Definition
Focus: Turning raw data into structured requirements.
Activities:
Writing user stories and establishing Acceptance Criteria (often using the Given-When-Then format).
Creating documentation like process models, wireframes, and data dictionaries.
Week 4: Prioritization & Scope Management
Focus: Deciding what gets built first.
Activities:
Facilitating prioritization sessions using frameworks like the MoSCoW Method (Must have, Should have, Could have, Won’t have).
Defining the Minimum Viable Product (MVP) to prevent scope creep.
Week 5: Backlog Refinement & Solution Design
Focus: Preparing work for the development team.
Activities:
Refining the product backlog alongside the Product Owner.
Working directly with UI/UX designers and technical architects to ensure designs align with business rules.
Week 6: Development Support & Clarification
Focus: Answering daily questions and unblocking the team.
Activities:
Hosting Agile ceremonies like Sprint Planning and Daily Stand-ups.
Clarifying edge cases and adjusting requirements if technical constraints arise during development.
Week 7: Testing & Validation
Focus: Ensuring the solution works and meets business needs.
Activities:
Assisting Quality Assurance (QA) teams by explaining acceptance criteria.
Facilitating User Acceptance Testing (UAT) with real business users to sign off on the software.
Week 8: Deployment & Post-Implementation Review
Focus: Launching the product and measuring success.
Activities:
Helping prepare training materials, user manuals, and release notes.
Conducting a Retrospective to identify process improvements for the next project phase.
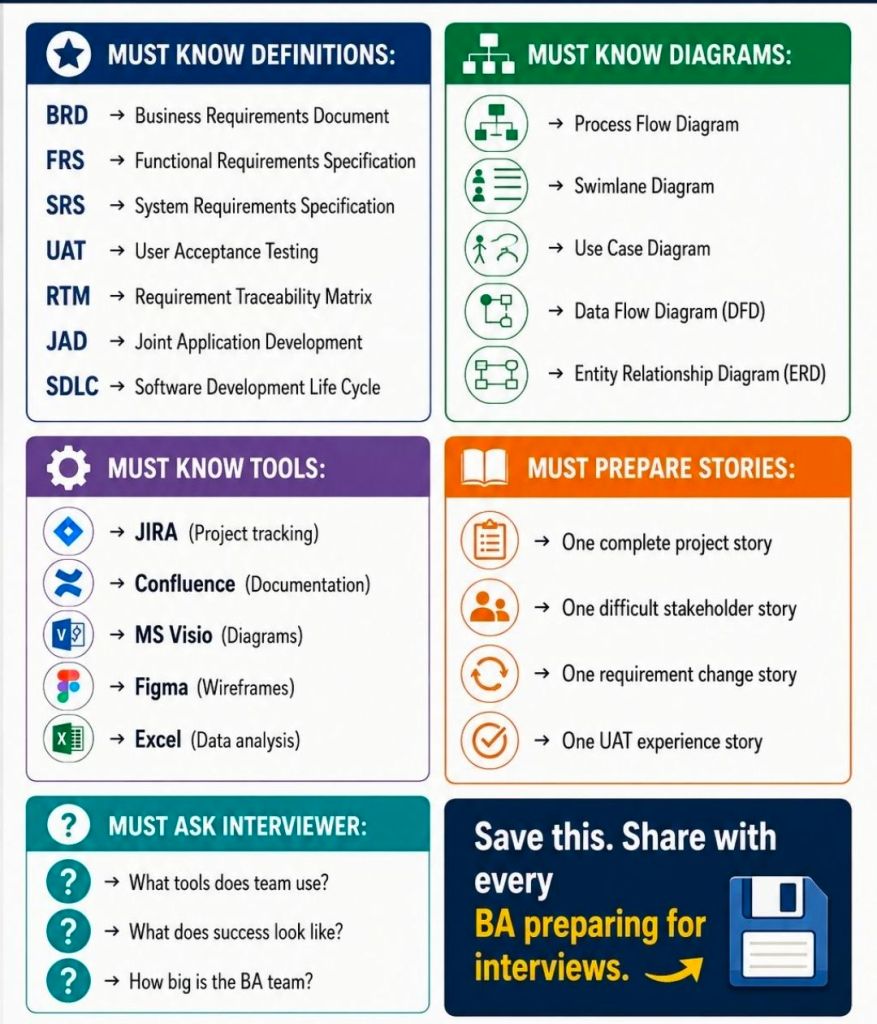
Business Analyst (BA) interview prep focuses on demonstrating how you translate business problems into technical/process solutions. Preparation revolves around three core pillars: competence (technical knowledge), communication (behavioral stories), and cultural fit.
1. Technical & Core Knowledge Prep
Familiarize yourself with the fundamental BA methodologies, documentation, and tools:
Methodologies: Understand the differences between Agile (Scrum, Kanban, sprints, user stories) and Waterfall (structured phase-gating).
Documentation: Review how to create a Business Requirements Document (BRD), Functional Requirements Document (FRD), and Software Requirements Specification (SRS).
Process Modeling: Refresh your knowledge on reading and creating Use Cases, User Stories, and UML diagrams (Activity diagrams, Flowcharts).
Requirements Gathering: Be ready to discuss techniques like interviews, workshops, prototyping, and document analysis.
2. Behavioral & Scenario Prep (The STAR/STARS Method)
Expect situational questions that require you to tell a story about your past experience. Structure your answers using the STAR method (Situation, Task, Action, Result):
Conflict Resolution: How do you align stakeholders with opposing views or conflicting priorities?
Scope Creep: How do you manage a stakeholder requesting major changes midway through a project?
Ambiguity: Tell me about a time you had to work with limited data or changing requirements.
Failure/Mistakes: Describe a time you made an analytical error or missed a requirement and how you resolved it.
3. Interview Action Items Checklist
Work Samples: Bring a physical or digital portfolio containing redacted work samples (e.g., a process flow, user story backlog, or requirements document you’ve built).
The 30-60-90 Day Plan: Think about how you would approach the first few months on the job. (e.g., Day 1-30: Learn the business domain; Day 31-60: Map current processes; Day 61-90: Identify optimization opportunities.)
Reverse Questions: Prepare engaging questions to ask the interviewer, such as: “What does success look like in this role in the first 6 months?” or “Can you share more about how BAs collaborate with the technical team here?”
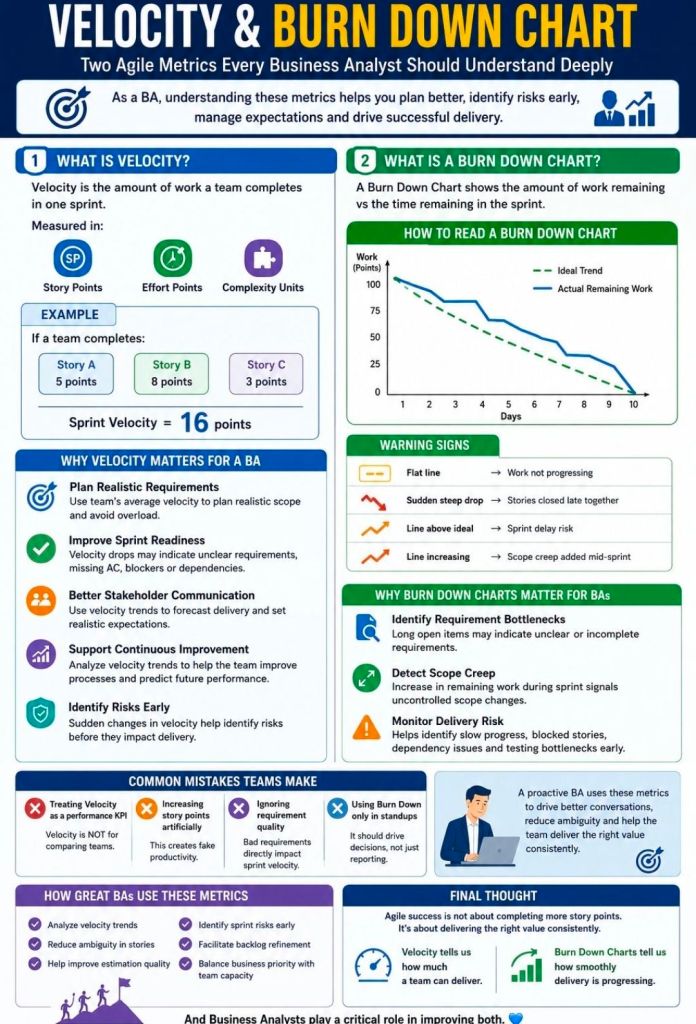
Scrum velocity and burndown charts are essential agile metrics used to measure team capacity and track progress. Velocity measures the average story points completed over past sprints to forecast future capacity. Burndown charts visually represent the remaining work daily, highlighting if the team is on track to meet sprint goals.
Scrum Velocity
Definition: The amount of work (usually in story points or hours) a team completes in a single sprint.
Purpose: Helps forecast team capacity for future sprints and promotes sustainable pace.
Calculation: Sum of story points for all “Done” items at the end of a sprint.
Best Practice: Average velocity over 3–5 sprints provides a more accurate, stable forecast.
Burndown Chart
Definition: A graph showing the amount of work remaining versus time (days) in a sprint.
Components:
Ideal Work Line: A straight line showing the projected pace to complete work.
Actual Work Line: A line plotting daily completed work against the ideal line.
Purpose: Provides daily visibility into progress and detects risks early (e.g., if the line is above the ideal, the team is behind).
Types: Sprint Burndown (short term) vs. Release/Product Burndown (long term).
Key Differences
Velocity is a planning metric looking at historical performance.
Burndown is a monitoring tool looking at current progress.
Common Pitfalls
Velocity: Treating velocity as a productivity metric (it is a capacity planning metric) or comparing it between teams.
Burndown: Using “manual updates” rather than automated tools, leading to inaccurate data.
Both: Neglecting to refine user stories, which makes velocity unpredictable and burndowns inaccurate.
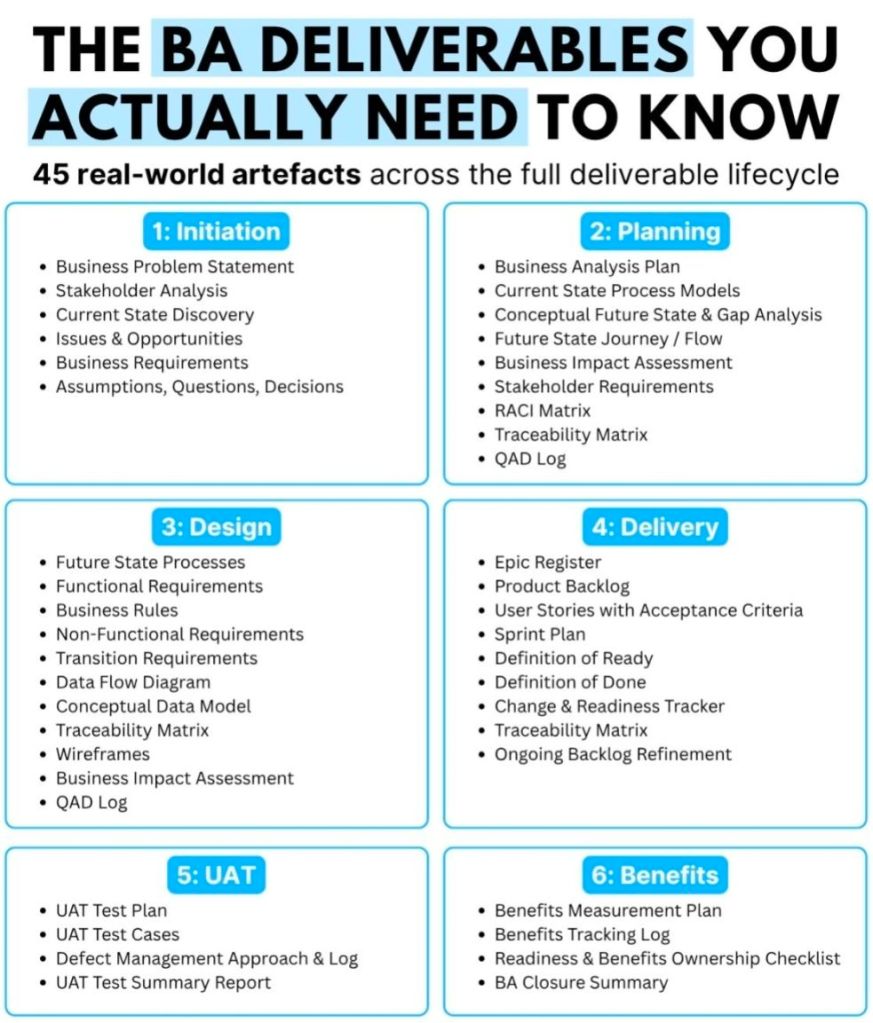
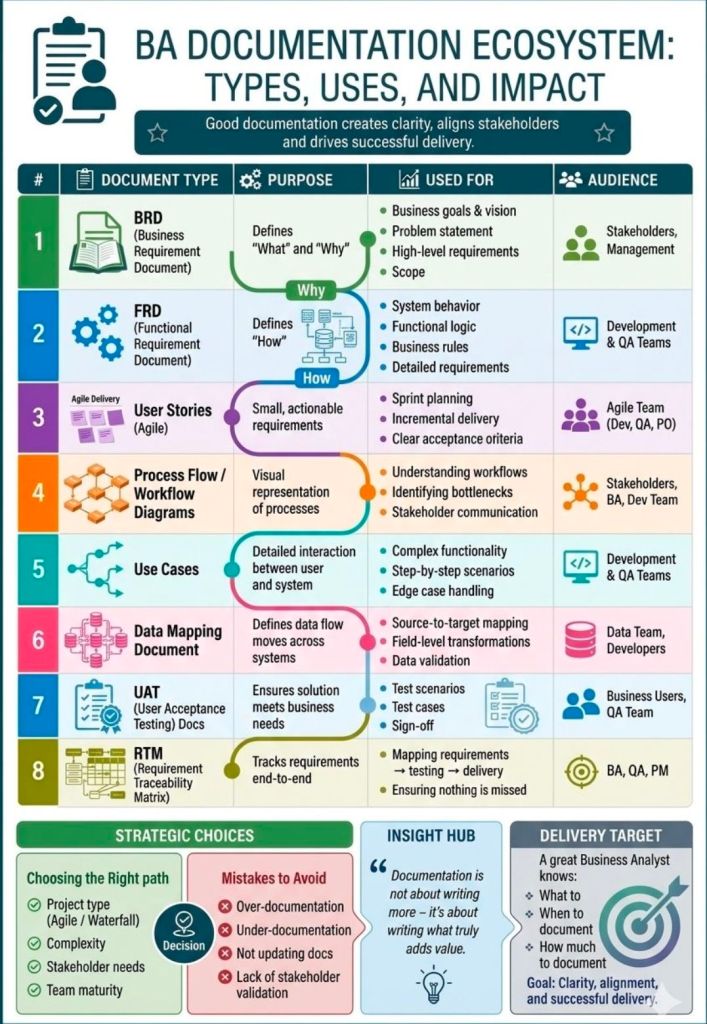
Business analyst deliverables are essential documentation and artifacts produced throughout a project to define business needs, bridge gaps between stakeholders and technical teams, and ensure solutions deliver value. Key deliverables include the Business Case, Stakeholder List, Requirement Packages (BRD/User Stories), Process Models, and Transition Requirements.
Core Business Analyst Deliverables by Phase:
Initiation/Discovery:
Business Case: Outlines the justification for the project, including cost-benefit analysis and ROI.
Problem Statement/Project Scope: Defines the “why” and boundaries of the project.
Stakeholder Map/Matrix: Identifies key stakeholders and their influence.
Planning:
Business Analysis Plan: Outlines the approach, tasks, and techniques to be used.
Communication Plan: Defines how stakeholders will receive updates.
Elicitation & Analysis:
Current State Assessment (As-Is): Documents how processes work today.
Future State Modeling (To-Be): Visualizes the desired future processes.
Gap Analysis: Details what needs to change to get from current to future state.
Business Requirements Document (BRD): A formal document detailing what the business needs to achieve.
Solution Definition (Design & Implementation):
Functional/Non-Functional Requirements (SRS): Technical details on how the system should act.
Use Cases/User Stories: Detailed scenarios of user interactions with the system.
Prototypes/Wireframes: Visual representations of user interfaces.
Product Backlog (Agile): A prioritized list of user stories.
Evaluation & Closure:
Acceptance Criteria & Test Cases: Defines the criteria for a completed feature.
Solution Assessment/Validation Report: Evaluates if the delivered solution met the needs.
Lessons Learned/Closing Report: Documents successes and improvements for future projects.
Key Takeaways:
Formal vs. Informal: Plan-driven (Waterfall) projects use heavy formal documentation (BRD, SRS), while change-driven (Agile) projects focus on lighter tools like user stories, Jira tickets, and prototypes.
Value-Driven: Deliverables exist to facilitate communication, align stakeholders, and ensure project success.
Note: The specific deliverables required are usually determined in the initial project planning stage.