Building a Microsoft Project MPP Plan in 5 Steps

The best approach to building a plan in Microsoft Project involves a structured, sequential workflow that configures global project settings first, inputs and links tasks dynamically, and finally layered resources and costs. Jumping straight into entering dates manually is the most common pitfall; instead, you should rely on the software’s automated scheduling engine to manage the timeline.
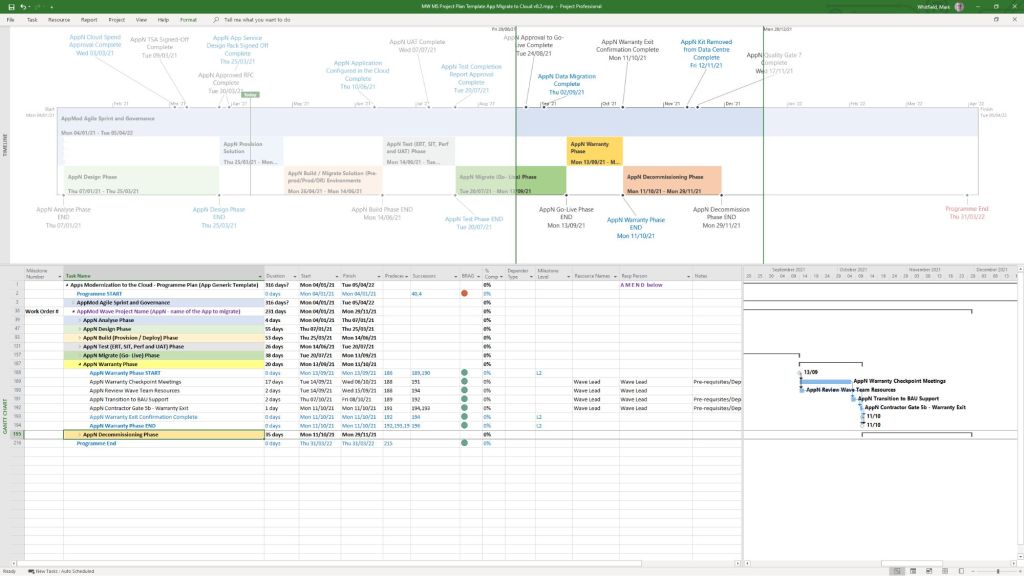
Microsoft Project MPP plan examples 
can be downloaded at banner link
Microsoft Project MPP plan examples
can be downloaded at banner link

Follow these sequential steps to build a bulletproof, dynamically adjusting schedule in Microsoft Project:

Step 1: Initialize Global Project Options

Before typing a single task name, configure the framework of the file so the software automates the hard math for you.

  • Set the Start Date: Navigate to Project > Project Information, and input your official project start date so all calculations anchor correctly.
  • Enforce Auto-Scheduling: Change the default task mode from “Manually Scheduled” to “Auto Scheduled” in the bottom-left status bar (or via File > Options > Schedule). This enables the scheduling engine to automatically adjust timelines based on dependencies.
  • Display the Project Summary Task: Go to the Format (or Gantt Chart Format) tab and check the Project Summary Task box. This creates a “Row 0” that automatically calculates the total duration, cost, and overall work of your entire project.
  • Configure Project Calendars: Click Project > Change Working Time to define standard working hours, weekends, and specific company holidays so work isn’t planned on non-working days.

Step 2: Build the Work Breakdown Structure (WBS)

Brainstorm your deliverables and list your tasks out comprehensively before worrying about their exact dates.

  • Input Phases and Tasks: Type your high-level project phases and specific action items under the Task Name column.
  • Indent to Create Hierarchy: Highlight your sub-tasks and click Task > Indent to nest them under your major phase rows. The parent rows automatically transform into bold Summary Tasks that roll up the schedules of everything underneath them.
  • Insert Milestones: Mark critical success checks, approvals, or delivery deadlines by creating a task and giving it a 0-day duration. This displays a distinct diamond symbol on your Gantt chart.

Step 3: Add Durations and Establish Logic

Now that the tasks exist, define how long they take and how they interact with one another.

  • Assign Durations Only: Enter estimated timeframes (e.g., 5d for days, 2w for weeks) in the Duration column. Never manually type dates into the Start or Finish columns, as doing so applies rigid constraints that break your dynamic scheduling engine.
  • Link Predecessors and Successors: Establish logic by entering row numbers into the Predecessors column, or by highlighting sequential tasks and clicking the Link Tasks icon (the chain link).
  • Use Relationships and Lags: Double-click a relationship line to shift from the standard Finish-to-Start (FS) hookup to Start-to-Start (SS) or Finish-to-Finish (FF), and add lead or lag time where necessary.

Step 4: Layer Resources and Check the Critical Path

A timeline is only realistic if you have the people and tools available to actually execute the work.

  • Build the Resource Sheet: Switch your view to the Resource Sheet and add your team members, material items, or equipment along with their standard hourly rates.
  • Assign Resources to Tasks: Return to the Gantt Chart view and use the Resource Names column to assign specific entities to individual sub-tasks. Project will now automatically compute the total labor hours and financial costs.
  • Analyze the Critical Path: Go to the Format tab and check Critical Tasks. The tasks that turn bright red dictate your project’s final finish date; if any of these slip by a single day, your entire project deadline slips.

Step 5: Lock in the Baseline

Once your stakeholders formally approve this initial schedule, you must lock it down before tracking day-to-day progress.

  • Go to Project > Set Baseline > Set Baseline.
  • This saves a permanent snapshot of your original plan’s dates, durations, and costs. As the project gets underway and actual hours are recorded, you can use the Tracking Gantt view to instantly see where you are drifting from your original commitments.

Building a Microsoft Project MPP Plan in 5 Steps
API (Application Programming Interface) for Business Analysts BA

An API (Application Programming Interface) is a set of rules that lets different software programs communicate and share data with each other. Think of it like a waiter in a restaurant: you (the application) place an order (a request), and the waiter takes it to the kitchen (the server) and brings back exactly what you asked for.

API Application Programming Interface for Business Analysts BA
API (Application Programming Interface)
for Business Analysts BA

How They Work

  • The Request: One program asks another for specific data or actions using an API call.
  • The Rules: The API dictates exactly how this request must be formatted to ensure security and consistency.
  • The Response: The receiving program processes the request and sends the requested information or executes the task.

For business analysts (BAs), APIs are crucial business enablers that connect systems, automate workflows, and drive revenue. Categorizing APIs helps BAs identify technical impacts, scope integration requirements, and align solutions with strategic business goals.

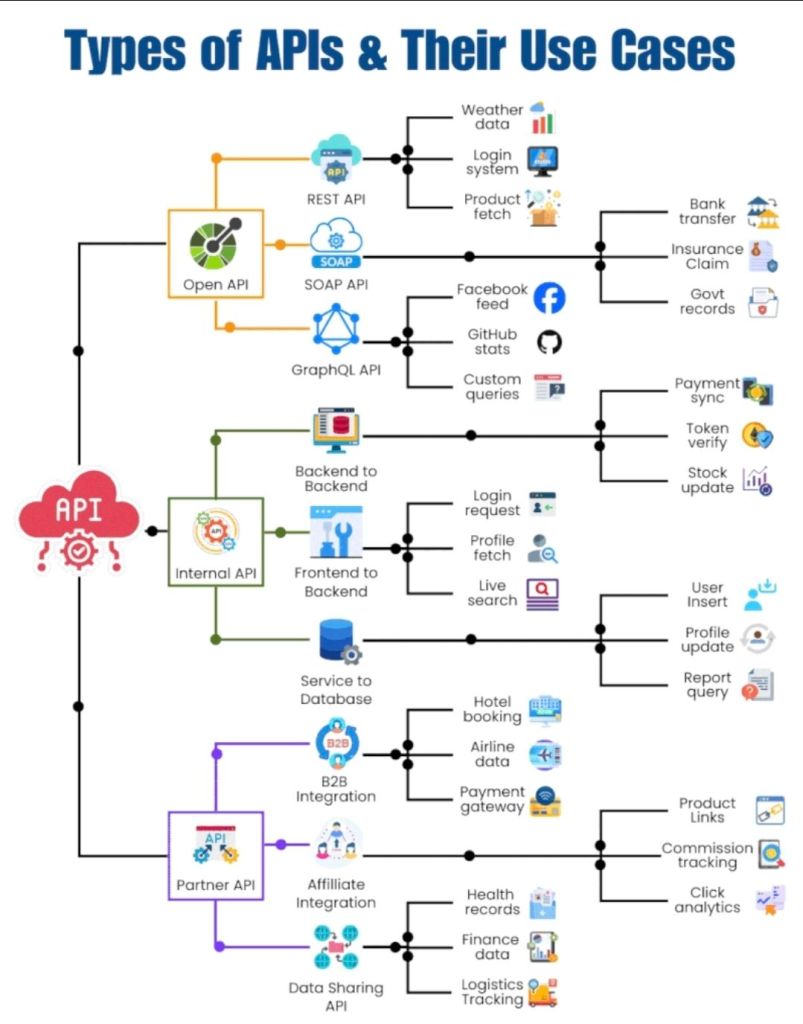
Categorization can be divided into three primary frameworks: Access Level, Business Purpose, and Architecture Style.

1. By Access Level (Audience)

This categorization defines who has permission to use the API and dictates security requirements.

  • Internal (Private) APIs: Developed by a company strictly for internal use. These connect backend systems (e.g., a CRM talking to an ERP) or allow different internal departments to share data securely.
  • Partner APIs: Shared specifically with external business partners or vendors. These require strict authentication and agreements to streamline supply chain or B2B operations (e.g., granting a distributor inventory access).
  • Public (Open) APIs: Exposed to developers and the general public to foster third-party integrations, app development, or ecosystem growth. They often require an API key or OAuth for tracking usage.

2. By Business Purpose (API-led Connectivity)

This approach, often used in integration methodologies like MuleSoft, categorizes APIs by their role in the enterprise architecture.

  • System APIs: Unlock data directly from core systems of record (e.g., a legacy database, an ERP, or a billing system).
  • Process APIs: Interact with and shape data across multiple systems to break down data silos (e.g., an API that takes order fulfillment data and formats it for shipment and inventory updates).
  • Experience APIs: Provide a business context for the data to be easily consumed by end-user interfaces like mobile applications, web portals, or chatbots (e.g., fetching a 360-degree customer view).

3. By Architecture Style (Technical Format)

While solution architects define the exact protocol, BAs must understand these styles to document data flow, map payloads, and communicate limitations with developers.

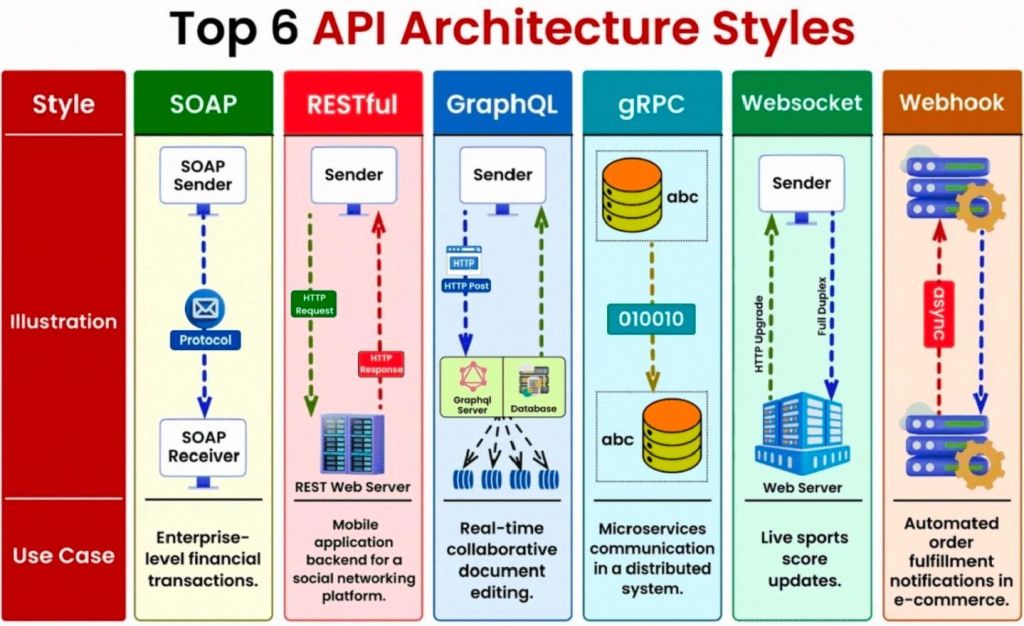
  • REST (Representational State Transfer): The most common web API standard. It uses HTTP methods to transfer data in simple formats like JSON.
  • SOAP (Simple Object Access Protocol): An older, highly structured protocol heavily used in enterprise and highly regulated industries (like banking and healthcare).
  • GraphQL: A query language for APIs that allows the client (e.g., a mobile app) to request exactly the specific data it needs, rather than fetching entire datasets.
  • Webhooks: Automated, event-driven APIs. Rather than a client requesting data, the server “pushes” data to the client the moment a specific event happens (e.g., sending a receipt to an app the instant a payment clears).
API Architecture Styles

Key API Concepts for BAs

Business analysts rarely build APIs, but they must understand high-level concepts to document API requirements effectively:

  • Payload: The data that is being sent (Request) or received (Response).
  • CRUD / HTTP Methods: The basic actions mapped to data. BAs need to understand GET (Read), POST (Create), PUT/PATCH (Update), and DELETE (Remove).
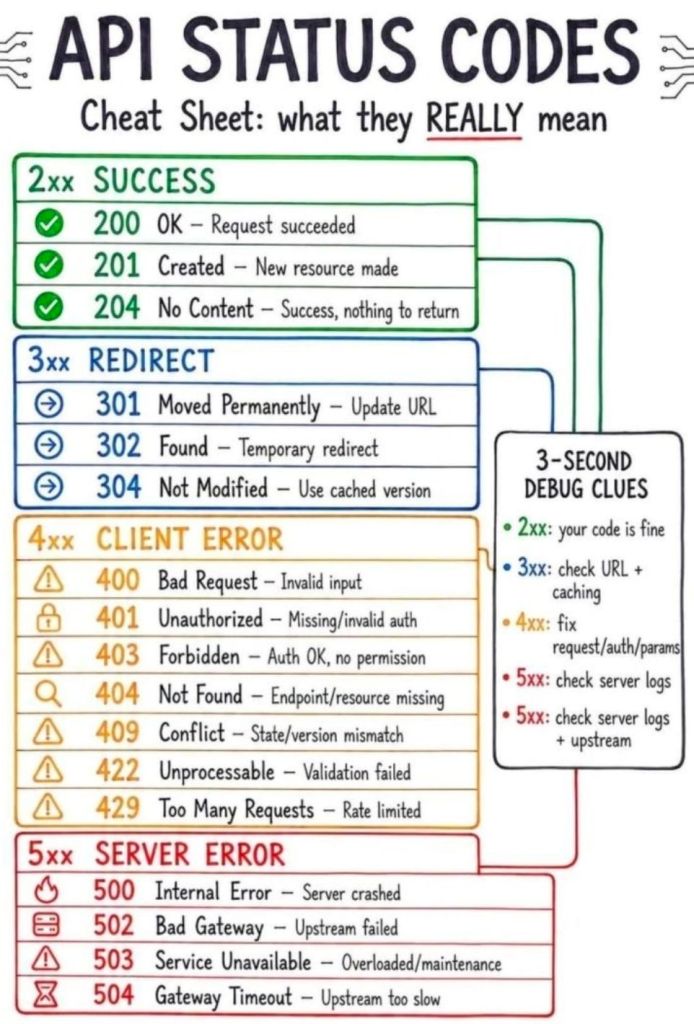
  • Status Codes: Standardized numbers that indicate the result of a request (e.g., 200 for success, 404 for not found, or 500 for server error).
  • Documentation: BAs use standards like Swagger/OpenAPI to interpret how an API should behave.
Status Codes, Standardized numbers that indicate the result of a request (e.g., 200 for success, 404 for not found, or 500 for server error)
API Status Codes – standardized numbers
that indicate the result of a request

API (Application Programming Interface) for Business Analysts BA

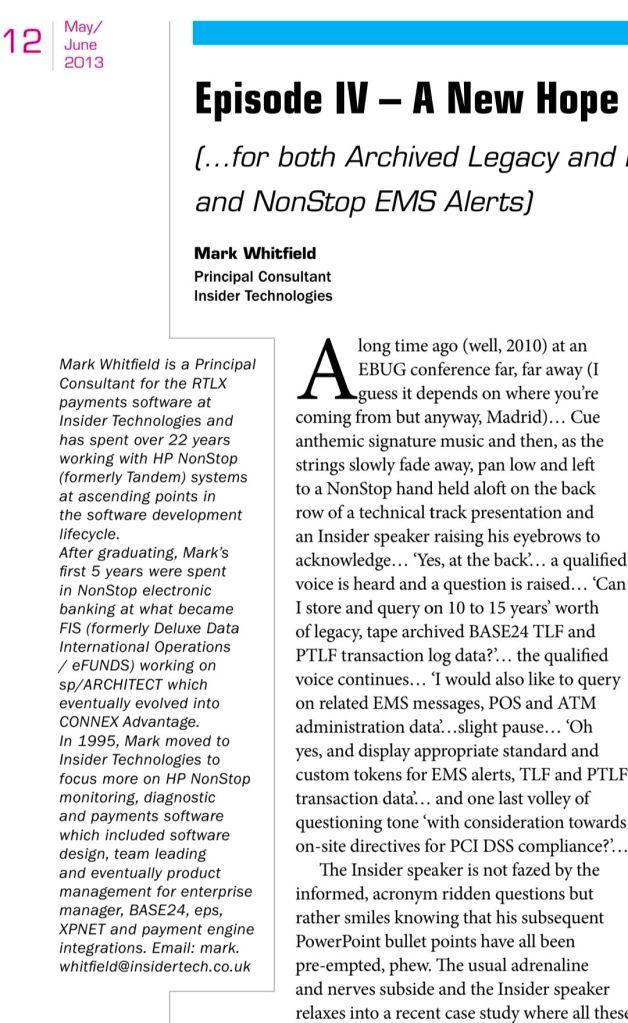
Mark Whitfield Career Timeline by era and project

Mark Whitfield’s IT project management and software engineering career spans over three decades, progressing from early electronic banking programming on Tandem Mainframes (now known as HPE NonStop) to senior delivery of enterprise-scale middleware, cloud, and digital transformation initiatives.

The high-level chronological timeline (with links) of his professional eras and key project history is broken down below.


💻 1990–1995: Early Programming & Lead Analysis Era

During this foundational era, Whitfield operated as a Programmer and Lead Analyst specializing in core electronic banking software frameworks.

  • The Software Partnership / Deluxe Data (1990–1995): Developed and enhanced the sp/ARCHITECT-BANK platform. His technical responsibilities focused heavily on coding within Tandem Mainframe environments (now HPE NonStop) using C, C++, TAL, COBOL, and PATHWAY architectures.
Deluxe Data International Operations, Wingate House, Northway
Deluxe Data International Operations,
Wingate House, Northway, Runcorn
  • Barclays On-Site Delivery (Early 1990s): Deployed on-site at the Barclays facility in Knutsford, Cheshire. He was responsible for core code development and system architecture design on the Barclays Business Master II (BBM II) electronic banking initiative and subsequent billing modules developed in Poole, Dorset.
Barclays, Wimborne Road, Poole, Dorset
Barclays, Wimborne Road,
Poole, Dorset

🛠️ 1995–2013: Senior Development & Strategic Project Management Era

Transitioning to Insider Technologies Limited at Salford Quays, Manchester, Whitfield progressed into high-level technical project delivery and strategic product management.

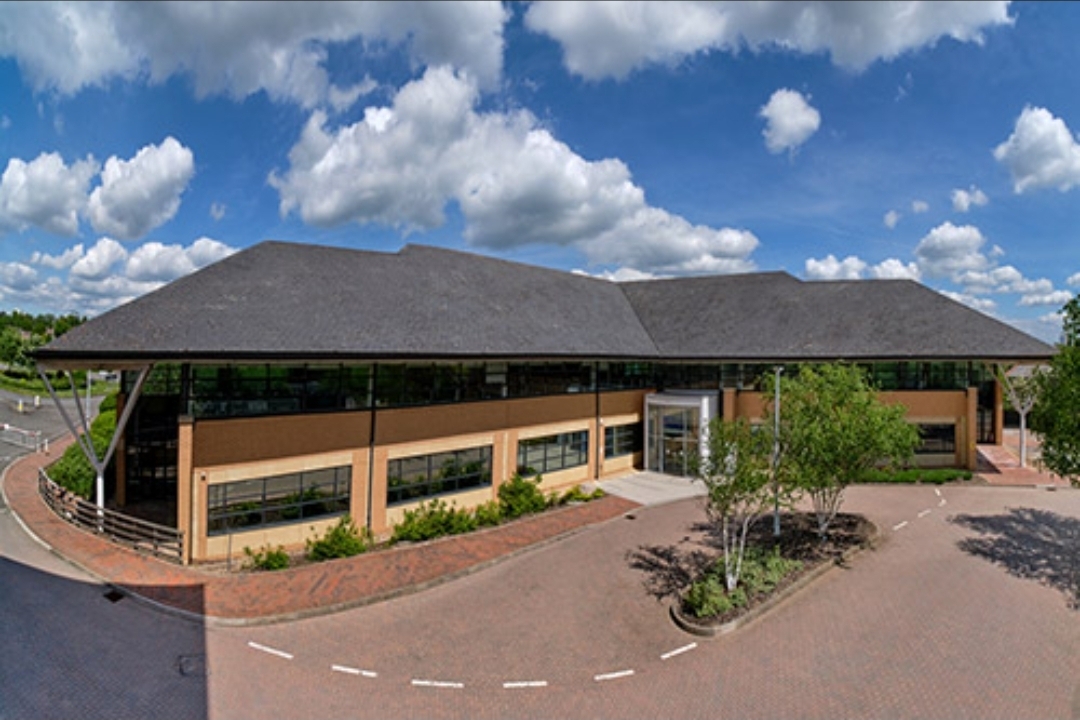
Insider Technologies Limited (ITL) in 2001, Salford Quays, Chandlers Point
  • Reflex Monitoring Suite R&D (1995–1996): Appointed as a core developer to design platform health and diagnostic plug-in modules for the flagship Reflex 80:20 tracking console.
  • CRESTCo Infrastructure Integration (1997–1998): Acted as a technical infrastructure consultant for CRESTCo (now Euroclear). Managed hardware benchmark coding and testing for newly deployed Tandem S7000 processing nodes.
CRESTCo in 1997 on St. Katherine’s Dock near Tower Hill tube station
CRESTCo in 1997 on St. Katherine’s Dock
near Tower Hill tube station
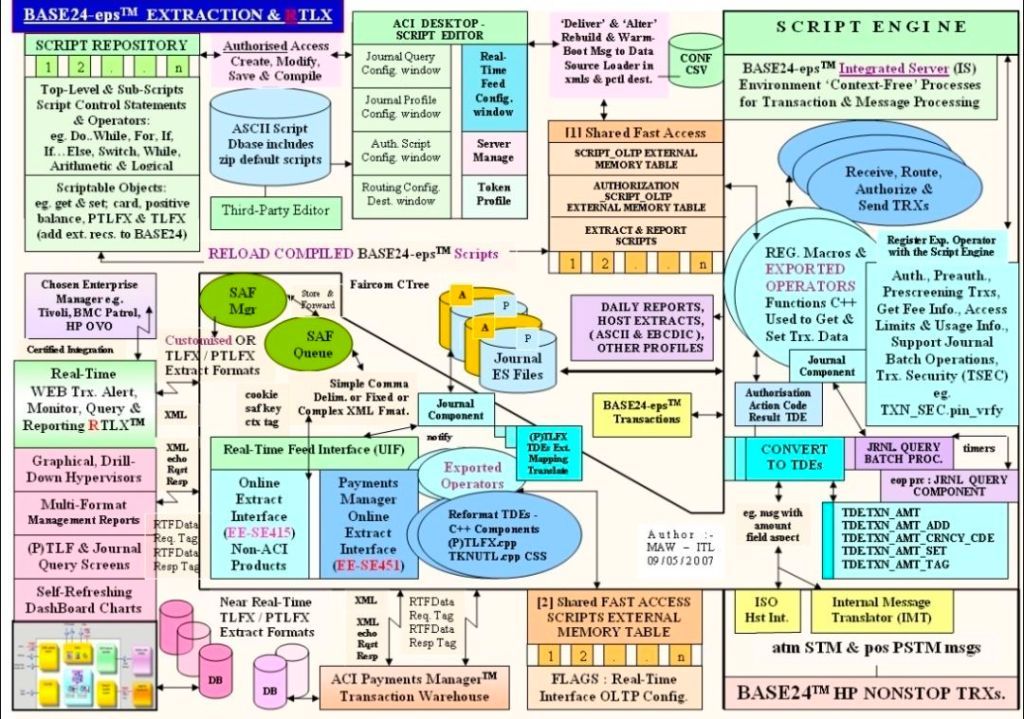
first HP OpenView Operations (OVO) Smart Plug-In built for NonStop mainframe environments
First HP OpenView Operations Smart Plug-In
for HPE NonStop environments
  • ATM Log Extraction Deployments (2004–2007): Led technical delivery teams implementing automated transaction log extraction layers (RTLX and Sentra) to audit ATM networks for major retail financial brands like Alliance & Leicester (now Santander) and HSBC.
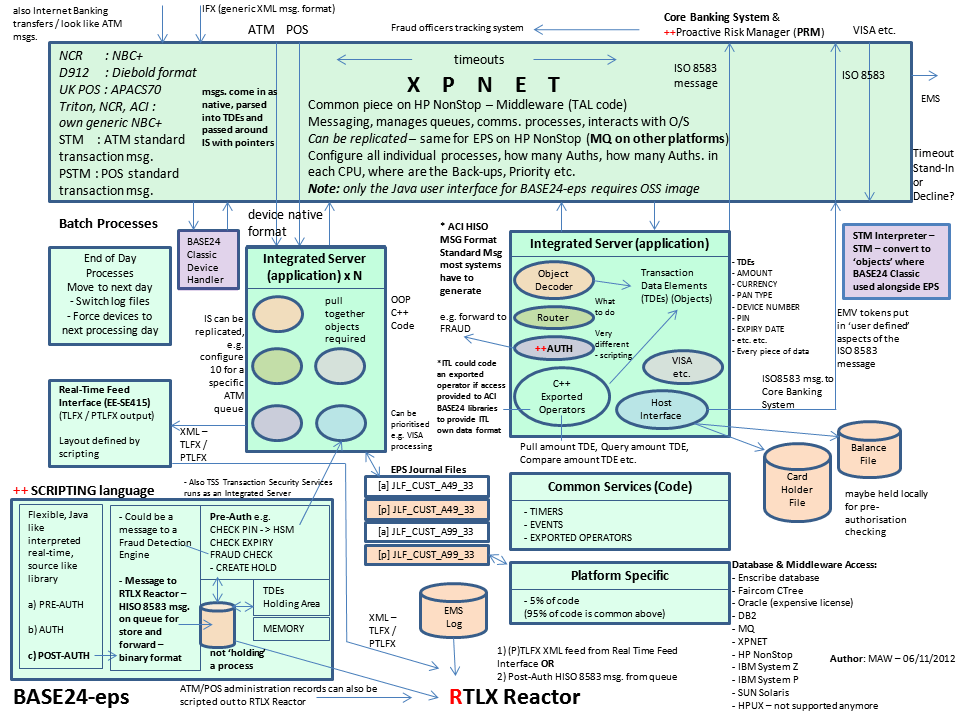
ATM Log Extraction Deployments 
(2004–2007) - RTLX Reactor
ATM Log Extraction Deployments
(2004–2007) – RTLX Reactor
cross-border ATM and Point-of-Sale (POS) environment monitoring expansion
Cross-border ATM and Point-of-Sale (POS) environment monitoring expansion
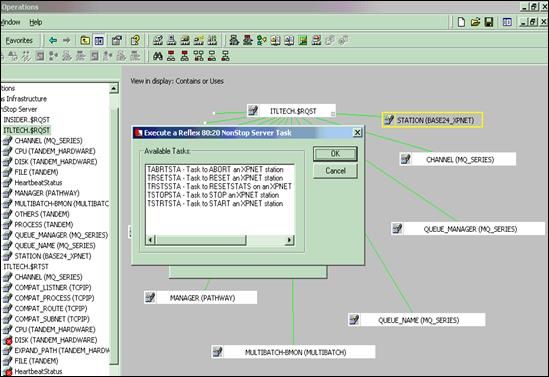
  • Enterprise Transaction Monitoring (2011–2013): Functioned as Project Lead to bridge retail banking transaction networks with corporate governance architectures. Integrated critical pathways for Standard Chartered and Global Payments into TIVOLI and XPERT24 using ACI’s XPNET infrastructure.

🏦 2013–2014: Professional Services Banking Delivery Era

Whitfield moved into consultant-driven professional services, directly aligning tech components with client business roadmaps.

Diebold Nixdorf Ltd, Berkshire, One The Blvd, Cain Rd, Binfield, Bracknell, RG12 1WP
Diebold Nixdorf Ltd, Cain Rd,
Binfield, Bracknell, RG12 1WP
  • Wincor Nixdorf Banking Division (2013–2014): Retained as Project Manager for Professional Services. He directed a massive hardware and software transition stream for Lloyds Banking Group’s Self-Service Software Replacement (SSSR) programme whilst also providing a qualified management link with Wincor Nixdorf, Paderborn (Germany) for subject matter expertise, as part of the transition.

🎮 2014–2016: Digital Infrastructure & Enterprise Betting Era

Whitfield shifted his delivery domain focus from banking mainframes into real-time high-transaction digital platforms.

☁️ 2016–Present: Cloud Integration, Middleware, & Public Sector Era

In this current era, Whitfield acts as a senior, SC-cleared Senior IT Project Manager specializing in hybrid cloud migrations and API-led integration.

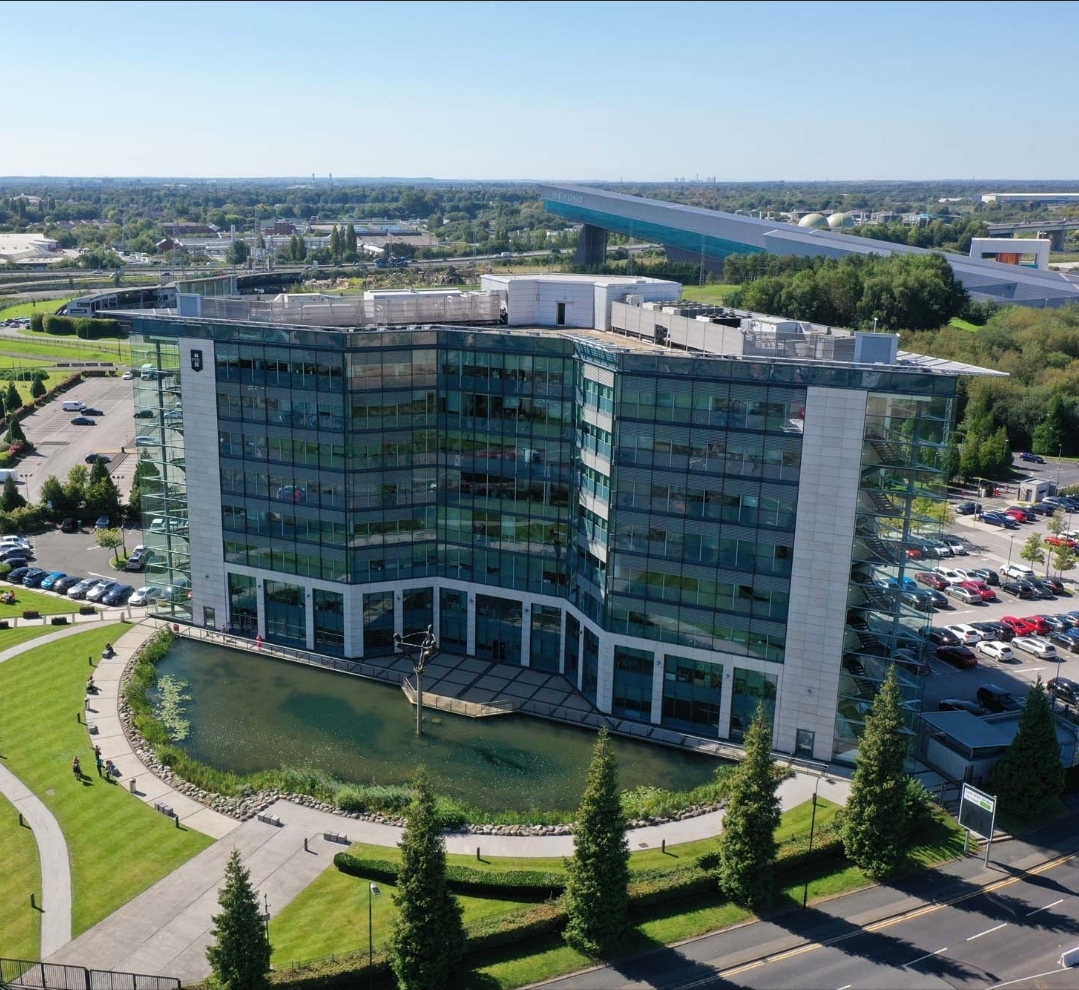
Capgemini UK, Floor 7, Venus Building, Trafford Quays, Manchester. M41 7HA
Capgemini UK, Floor 7,
Venus Building, Trafford Quays
  • Capgemini UK Consultancy (2016–Present): Leading massive corporate and public sector agile/waterfall delivery initiatives. His technical program management footprint expands across a vast roster of tier-one enterprise environments:
    • MuleSoft Ecosystem Deployments: Directing system integration projects utilising the Salesforce MuleSoft suite, spanning API lifecycle design, Anypoint Code Builder configurations, and hyper-automation flows.
    • Multi-Sector Enterprise Clients: Orchestrating cloud migrations, middleware application refactoring, and data pipelines for Jaguar Land Rover (JLR), Heathrow Airport, Royal Mail Group (RMG), NATS (National Air Traffic Services), Welsh Water, Rabobank, Barclays, and UK Export Finance (UKEF).
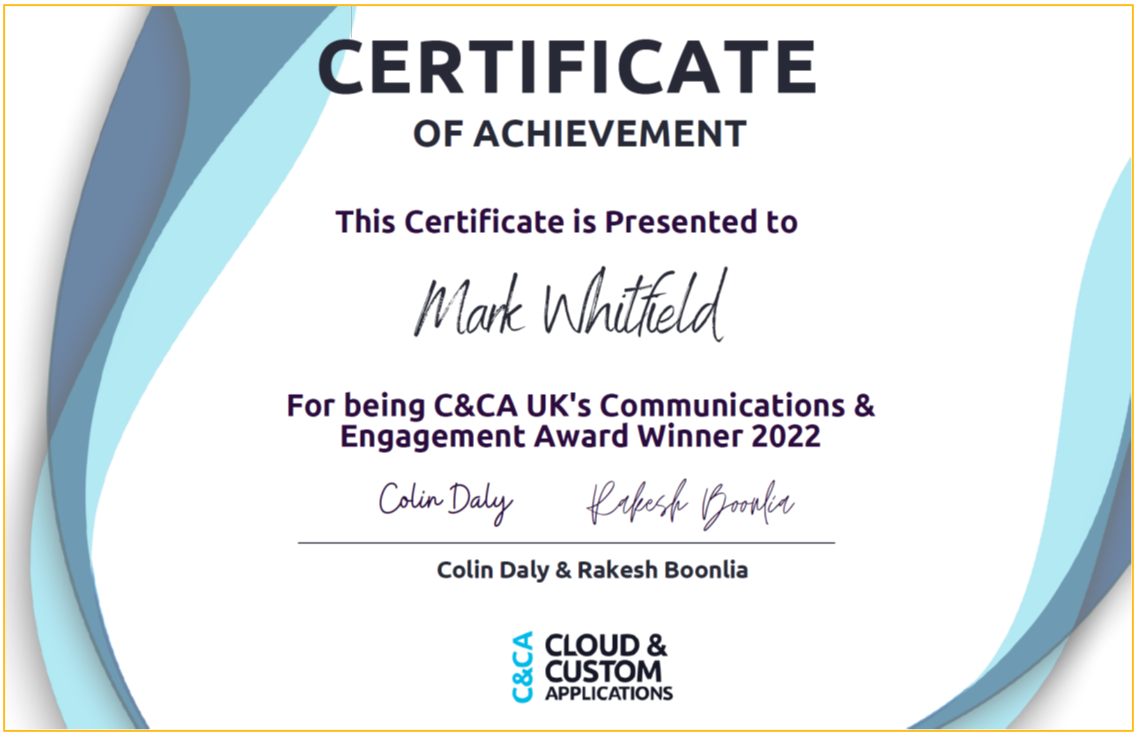
C&CA UK's Communications & Engagement Award Winner 2022 - Cloud & Custom Applications - Capgemini UK
C&CA UK’s Communications & Engagement Award Winner 2022 – Cloud & Custom Applications – Capgemini UK

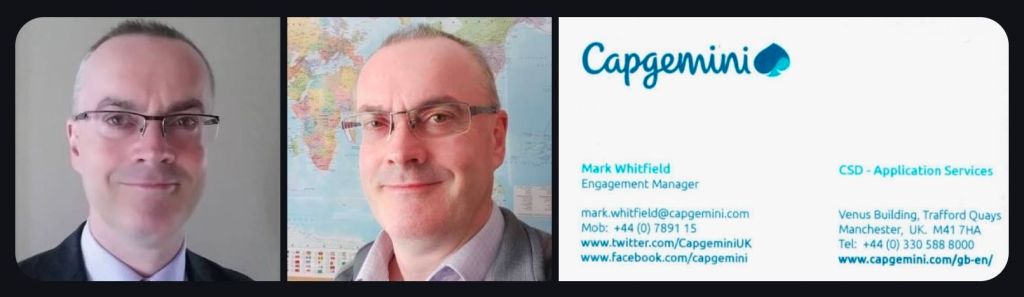
Mark Whitfield Career Timeline by era and project

SC Cleared Senior IT Project Manager Mark Whitfield
Senior IT Project Manager,
Mark Whitfield

Professional Training

Certificates

Recommendations

Education Summary

Graduation

i_Pro_PM_Templates on Flevy is a comprehensive library of 19 project management templates

The i_Pro_PM_Templates collection on Flevy is a highly comprehensive library of 19 specialized project management resources spanning Waterfall and Agile methodologies. Developed by a contributor with 30 years of project management experience, these fully editable files (PowerPoint, Excel, Word, and MS Project) are designed to bridge corporate strategy with rapid execution. The complete 200+ template ZIP file package can be purchased here also.

The specific templates offered by i_Pro_PM_Templates are organized below by their operational category and core function:


🗺️ 1. Project Planning & Roadmaps

Designed to provide executive stakeholders and project teams with high-level visualization and structured timelines.

  • Plan on a Page (PoaP) 30+ Examples (PowerPoint): Synthesises complex timelines into an executive-ready format.
  • Project Plan on a Page Template (Excel): Tracks milestones and deliverables on a single sheet.
  • Waterfall Project Planner with Gantt View (Excel): Automates timeline bars and highlights dependency tracking.
  • Microsoft Project Plan Editable Templates (MPP / MSP): Implements native tracking with pre-populated project paths.

📊 2. Project Governance & Status Reporting

Built to manage the cadence of team communications, track risks, and report progress up to the PMO.

  • Weekly Status Report (PowerPoint): Provides standardized internal and external updates for Agile or Waterfall projects.
  • Status Report with PoaP, RAIDs, & Burn Down (Excel): Combines execution charts with high-level summary roadmaps.
  • MS Excel RAID Log: Acts as a central command log for Risks, Issues, Dependencies, and Change Requests (CRs).

⚖️ 3. Value & Benefits Realization

Ensures project delivery aligns with financial targets and baseline calculations.

  • Programme & Project Benefits Realization Tracker (Excel): Uses automated calculations and RAG status indicators to ensure value delivery.
  • Project Finance Tracker (Excel): Integrates budget forecasting against actual financial performance.

📦 4. Comprehensive Master Toolkits

Bundled suites that consolidate hundreds of micro-assets into standalone lifecycle frameworks.

  • 200+ Project Management Templates Bundle (PDF/ZIP): Features customizable documents covering initialization through to closeout.
  • PRINCE2 Templates + MPP & Excel Pack: Embeds strict PRINCE2 project stages into functional tracking models.
  • MS Teams Free Planner Guide: Details how to organize and execute Agile backlogs directly inside Microsoft Teams.

A detailed breakdown of the exact templates published by this author, structured by their functional use and file format, includes the following:

📈 PowerPoint (PPT / PPTX) Formats

  • Plan on a Page (POaP) Examples: A 39-slide PowerPoint document providing high-level visual roadmap templates to summarize project delivery tracks for executives.
  • Weekly Status Report (Internal / External): A 15-slide PowerPoint designed for recurring project health reporting, configured for both Agile and Waterfall methodologies.

📊 Excel (XLS / XLSX) Formats

  • Waterfall Project Planner: A structured spreadsheet featuring built-in, automated Gantt view generation tools for scheduling sequential project stages.
  • Status Report with Plan on a Page & RAIDs: A hybrid workbook integrating high-level timelines, a Risk, Assumptions, Issues, and Dependencies (RAID) log, and an Agile burn-down chart tracker.
  • PRINCE2 Editable Planning & Cost Tracker: A financial tracking sheet customized specifically to align with the stage-gate requirements of the PRINCE2 methodology.

🛠️ Microsoft Project (MPP) Formats

  • Microsoft Project Plan Template: A baseline editable project plan native schedule built for resource loading and critical path tracking.
  • PRINCE2 Microsoft Project Plan: A pre-configured schedule mapped directly to standard PRINCE2 product breakdowns and stages.

Overview of HP OpenView Operations (OVO) and Timeline

Overview of HP OpenView Operations (OVO)

HP OpenView Operations (OVO) is a foundational enterprise systems management (ESM) platform designed to centrally monitor and manage infrastructure, multi-vendor operating systems, and enterprise applications across distributed IT environments.

The system operates on an Agent-Server Architecture. Core components include:

  • Management Server: Central hub that aggregates system logs, processes alerts, correlates events, and triggers automated remediation scripts.
  • Smart Plug-ins (SPIs): Specialized modular add-ons that inject domain-specific monitoring logic for applications like Oracle databases, Microsoft Active Directory, or SAP.
  • Intelligent Agents: Lightweight background processes deployed on managed nodes to collect log events, metrics, and state data, formatting them into structured OVO messages.
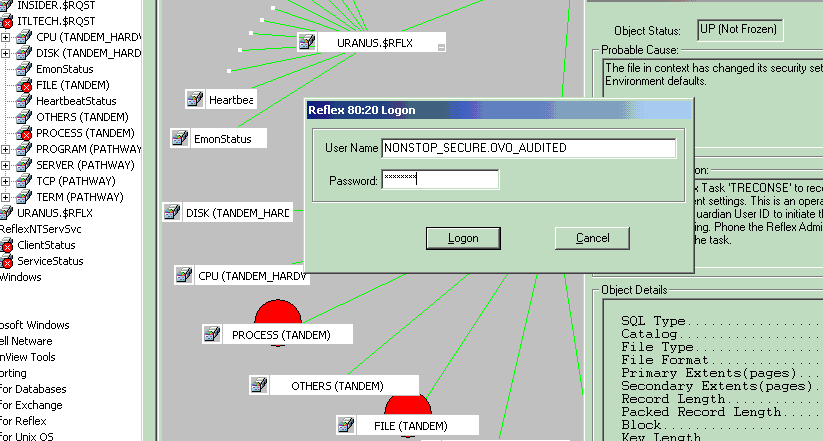
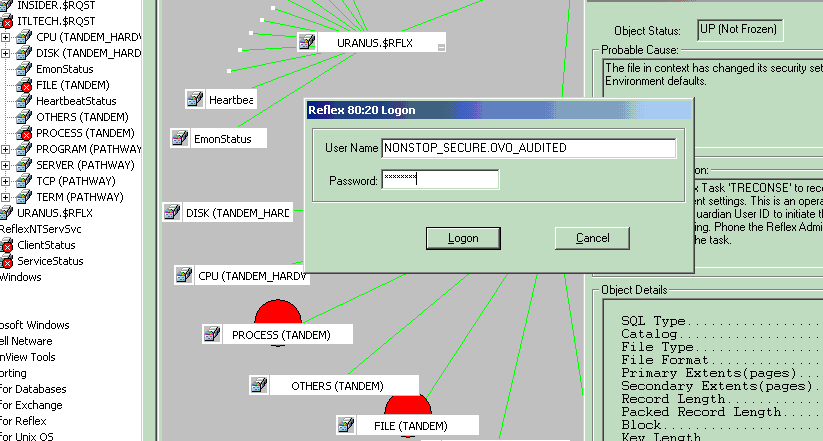
HP OVO screenshot in 2002, HPE NonStop (previously Tandem) Monitoring
1. HP OVO screenshot in 2002
2. HP OVO screenshot in 2002, HPE NonStop (previously Tandem) Monitoring
2. HP OVO screenshot in 2002

See bottom of this post for HPE NonStop (previously Tandem) monitoring in OpenText Operations Bridge Manager. I overlooked an integration with HP OpenView Operations for a HPE NonStop product in 2002, called Reflex 80:20.


Detailed Timeline Breakdown by Era and Year

🌅 Era 1: Origins and The Foundation (Late 1980s – 1994)

This era established HP’s footprints in IT infrastructure management, pivoting from pure SNMP network map discovery toward server telemetry.

  • Late 1980s: HP releases Operations Center (OpC) as an add-on application for its core Network Node Manager (NNM) platform. It replaces slow SNMP polling with Remote Procedure Calls (RPC) to gather host logs.
  • 1990–1993: HP scales OpC into a robust engine capable of executing basic automation scripts on remote UNIX boxes when specific thresholds break.

🚀 Era 2: The “ITO” and OpenView Operations Boom (1995 – 2000)

The framework shifted from isolated utilities into an integrated, market-dominating enterprise suite.

  • 1995: HP tightly merges NNM and Operations Center into a single product called IT Operations (ITO) Version 3.x.
  • 1996: HP OpenView Service Navigator is embedded into the product line. It provides a graphical hierarchy of business services instead of just a raw list of broken servers.
  • 1999: The suite formally adapts to include broad SNMP traps alongside its core agents and is renamed HP OpenView Operations ITO.

🔄 Era 3: Platform Split and VantagePoint Transition (2001 – 2006)

HP decoupled its codebases to natively handle Windows NT/2000 scaling alongside legacy Unix environments while heavily investing in product renaming.

  • 2001: HP briefy rebrands the suite to HP VantagePoint Operations (VPO). However, customer brand loyalty forces them to quickly pivot back to the popular HP OpenView Operations (OVO) naming convention.
  • 2002: Codebases officially bifurcate into OVOU (OpenView Operations for Unix) and OVOW (OpenView Operations for Windows, built natively on Microsoft WMI frameworks).
  • 2005: OVO Version 8.0 drops. It features heavy integration capabilities for external service desks, advanced HTTP/HTTPS agent communication protocols, and a refreshed Java GUI console.

🏢 Era 4: The Business Technology Optimization (BTO) Era (2007 – 2016)

Massive corporate acquisitions changed the software landscape. OVO ceased to be a standalone system monitoring tool and transformed into an automated operations center.

  • 2007: HP drops the legendary “OpenView” moniker. Following the acquisitions of Mercury Interactive, Peregrine, and Opsware, the suite is rebranded as HP Operations Manager (HPOM) under the HP Business Technology Optimization (BTO) banner.
  • 2009: HP rolls out Operations Manager i (OMi), integrating topology-based event correlation (TBEC) to suppress duplicate alert storms across the data center.
  • 2015: Hewlett-Packard splits into two companies; the portfolio lands under Hewlett Packard Enterprise (HPE). The engine is bundled into the HPE Operations Bridge (OpsBridge) suite.

☁️ Era 5: Divestiture and Modern Legacy (2017 – Present)

  • 2017: HPE spins off its enterprise software division. The entire legacy OpenView/Operations Manager portfolio is sold to Micro Focus.
  • 2023: OpenText completes its acquisition of Micro Focus. The underlying technical heritage of the old OVO agents survives today, evolved into cloud-ready containerized architectures inside the modern OpenText Operations Bridge cloud monitoring portfolio.
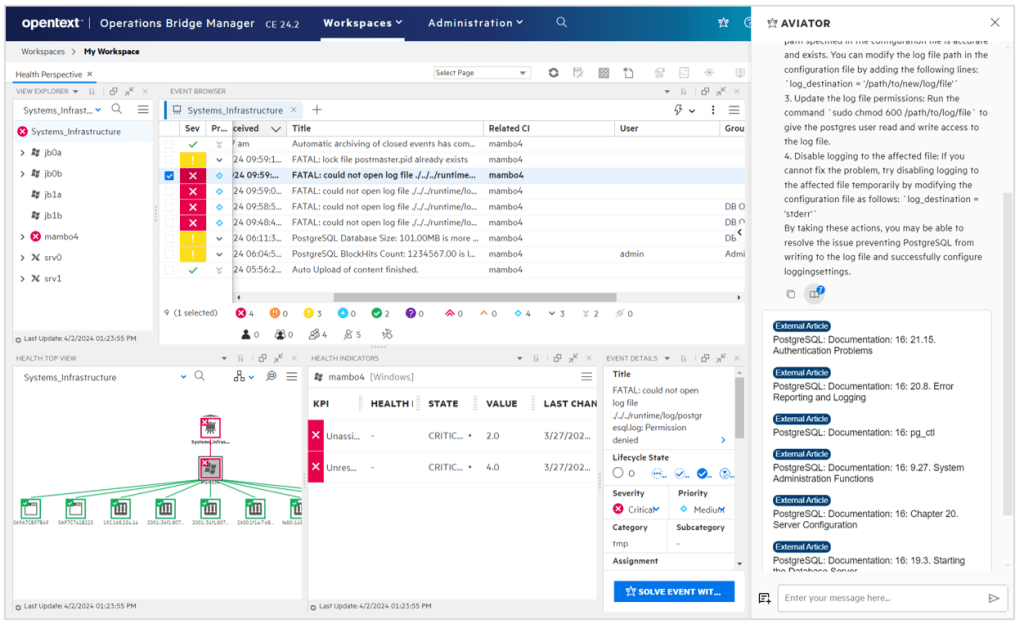
OpenText Operations Bridge Manager screenshot example
OpenText Operations Bridge Manager Screenshot example

HPE NonStop (previously Tandem) Monitoring

Micro Focus Operations Bridge (now part of OpenText AI Operations Management) provides end-to-end IT monitoring by consolidating data from over 200 sources. For HPE NonStop, it utilizes specialized Management Packs to ingest metrics, system events, and health data for comprehensive, real-time hybrid IT analysis.

To monitor HPE NonStop servers using the modern OpenText Operations Bridge/AIOps platform, the setup revolves around the Operations Bridge Manager (OBM) and targeted management packs:

  • Management Packs for HPE NonStop: OpenText provides specific management packs and solutions designed for NonStop systems. These capture system health, CPU/disk metrics, pathway status, and system messages.
  • Operations Agent: A lightweight agent is deployed directly on the NonStop nodes, which securely streams local performance data and events back to the central OBM console.
  • Centralized Event Consolidation: OBM acts as a “manager of managers”. It ingests the NonStop events and correlates them alongside data from your cloud (AWS/Azure), containers, and network endpoints.
  • AIOps and Remediation: The platform utilizes built-in machine learning to reduce alert noise and accelerate root cause analysis. You can also use automated Runbooks to automatically remediate known issues on the NonStop platform.

Because the platform has been fully integrated into the OpenText portfolio, these integrations are supported across containerized deployments, on-premise, or SaaS models.

Father’s Day present, home made Space Invader band

Father's Day present, home made Space Invader band
Father’s Day present, home made
Space Invader band

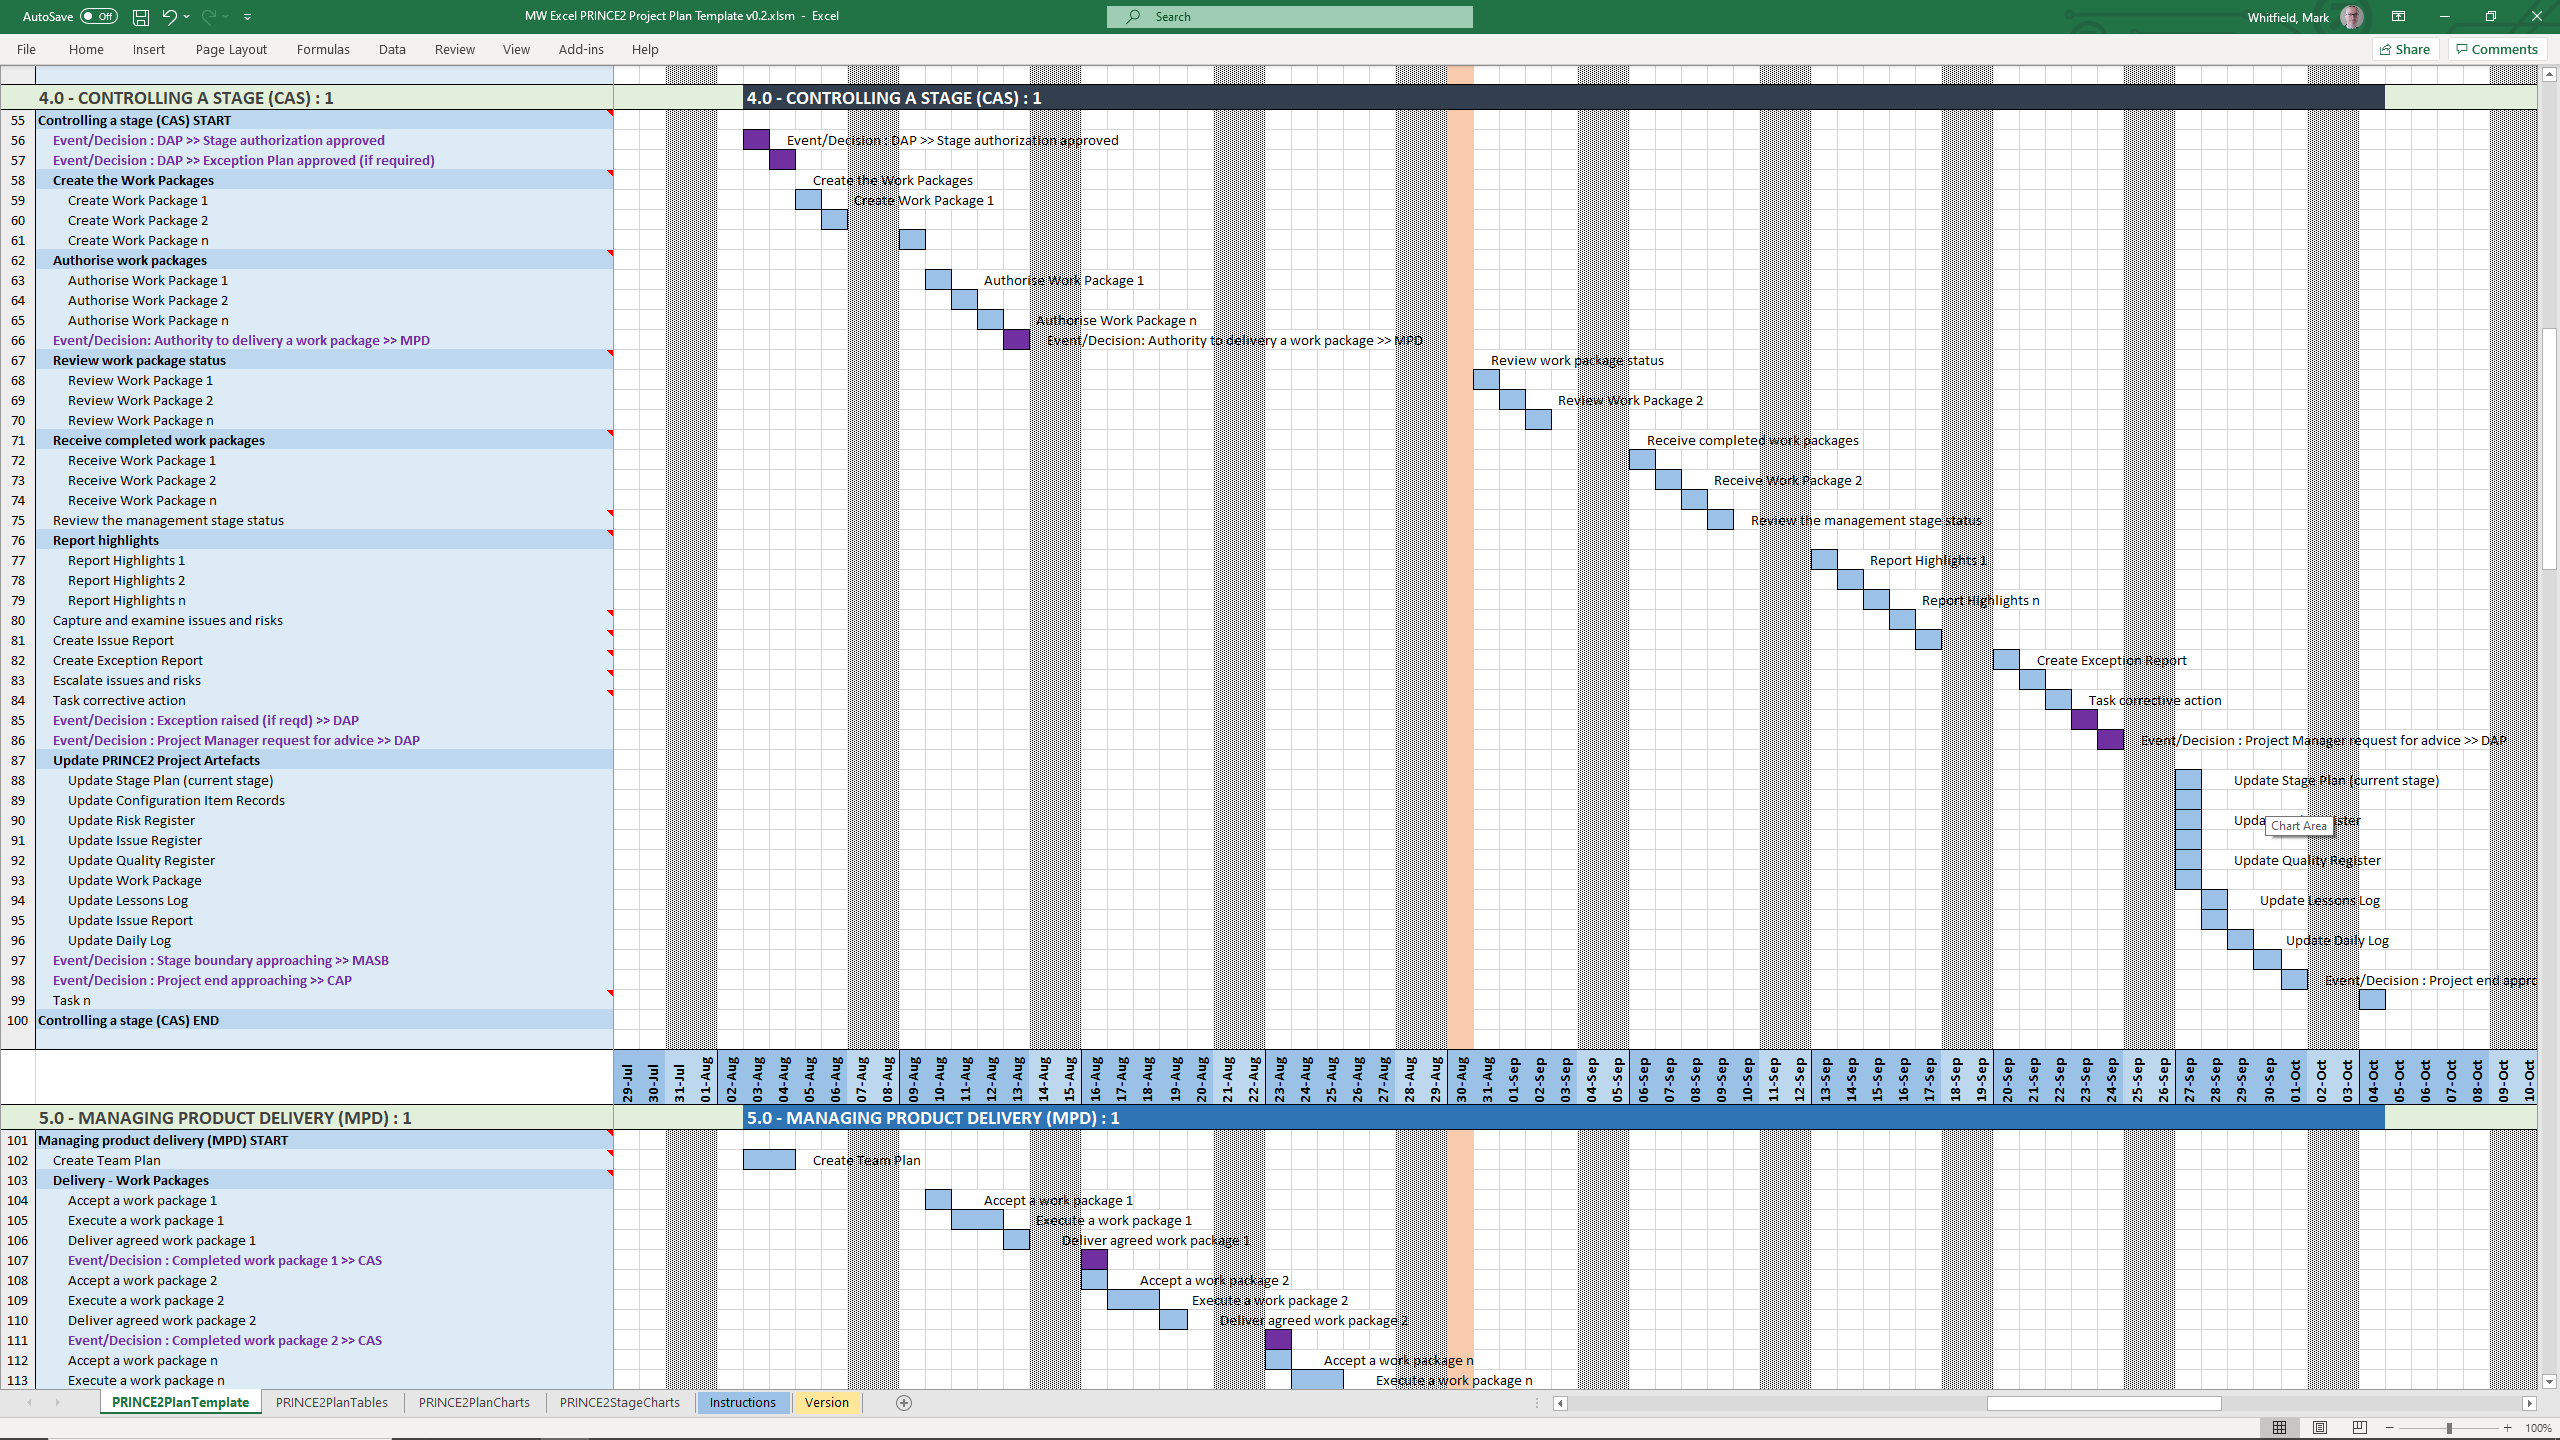
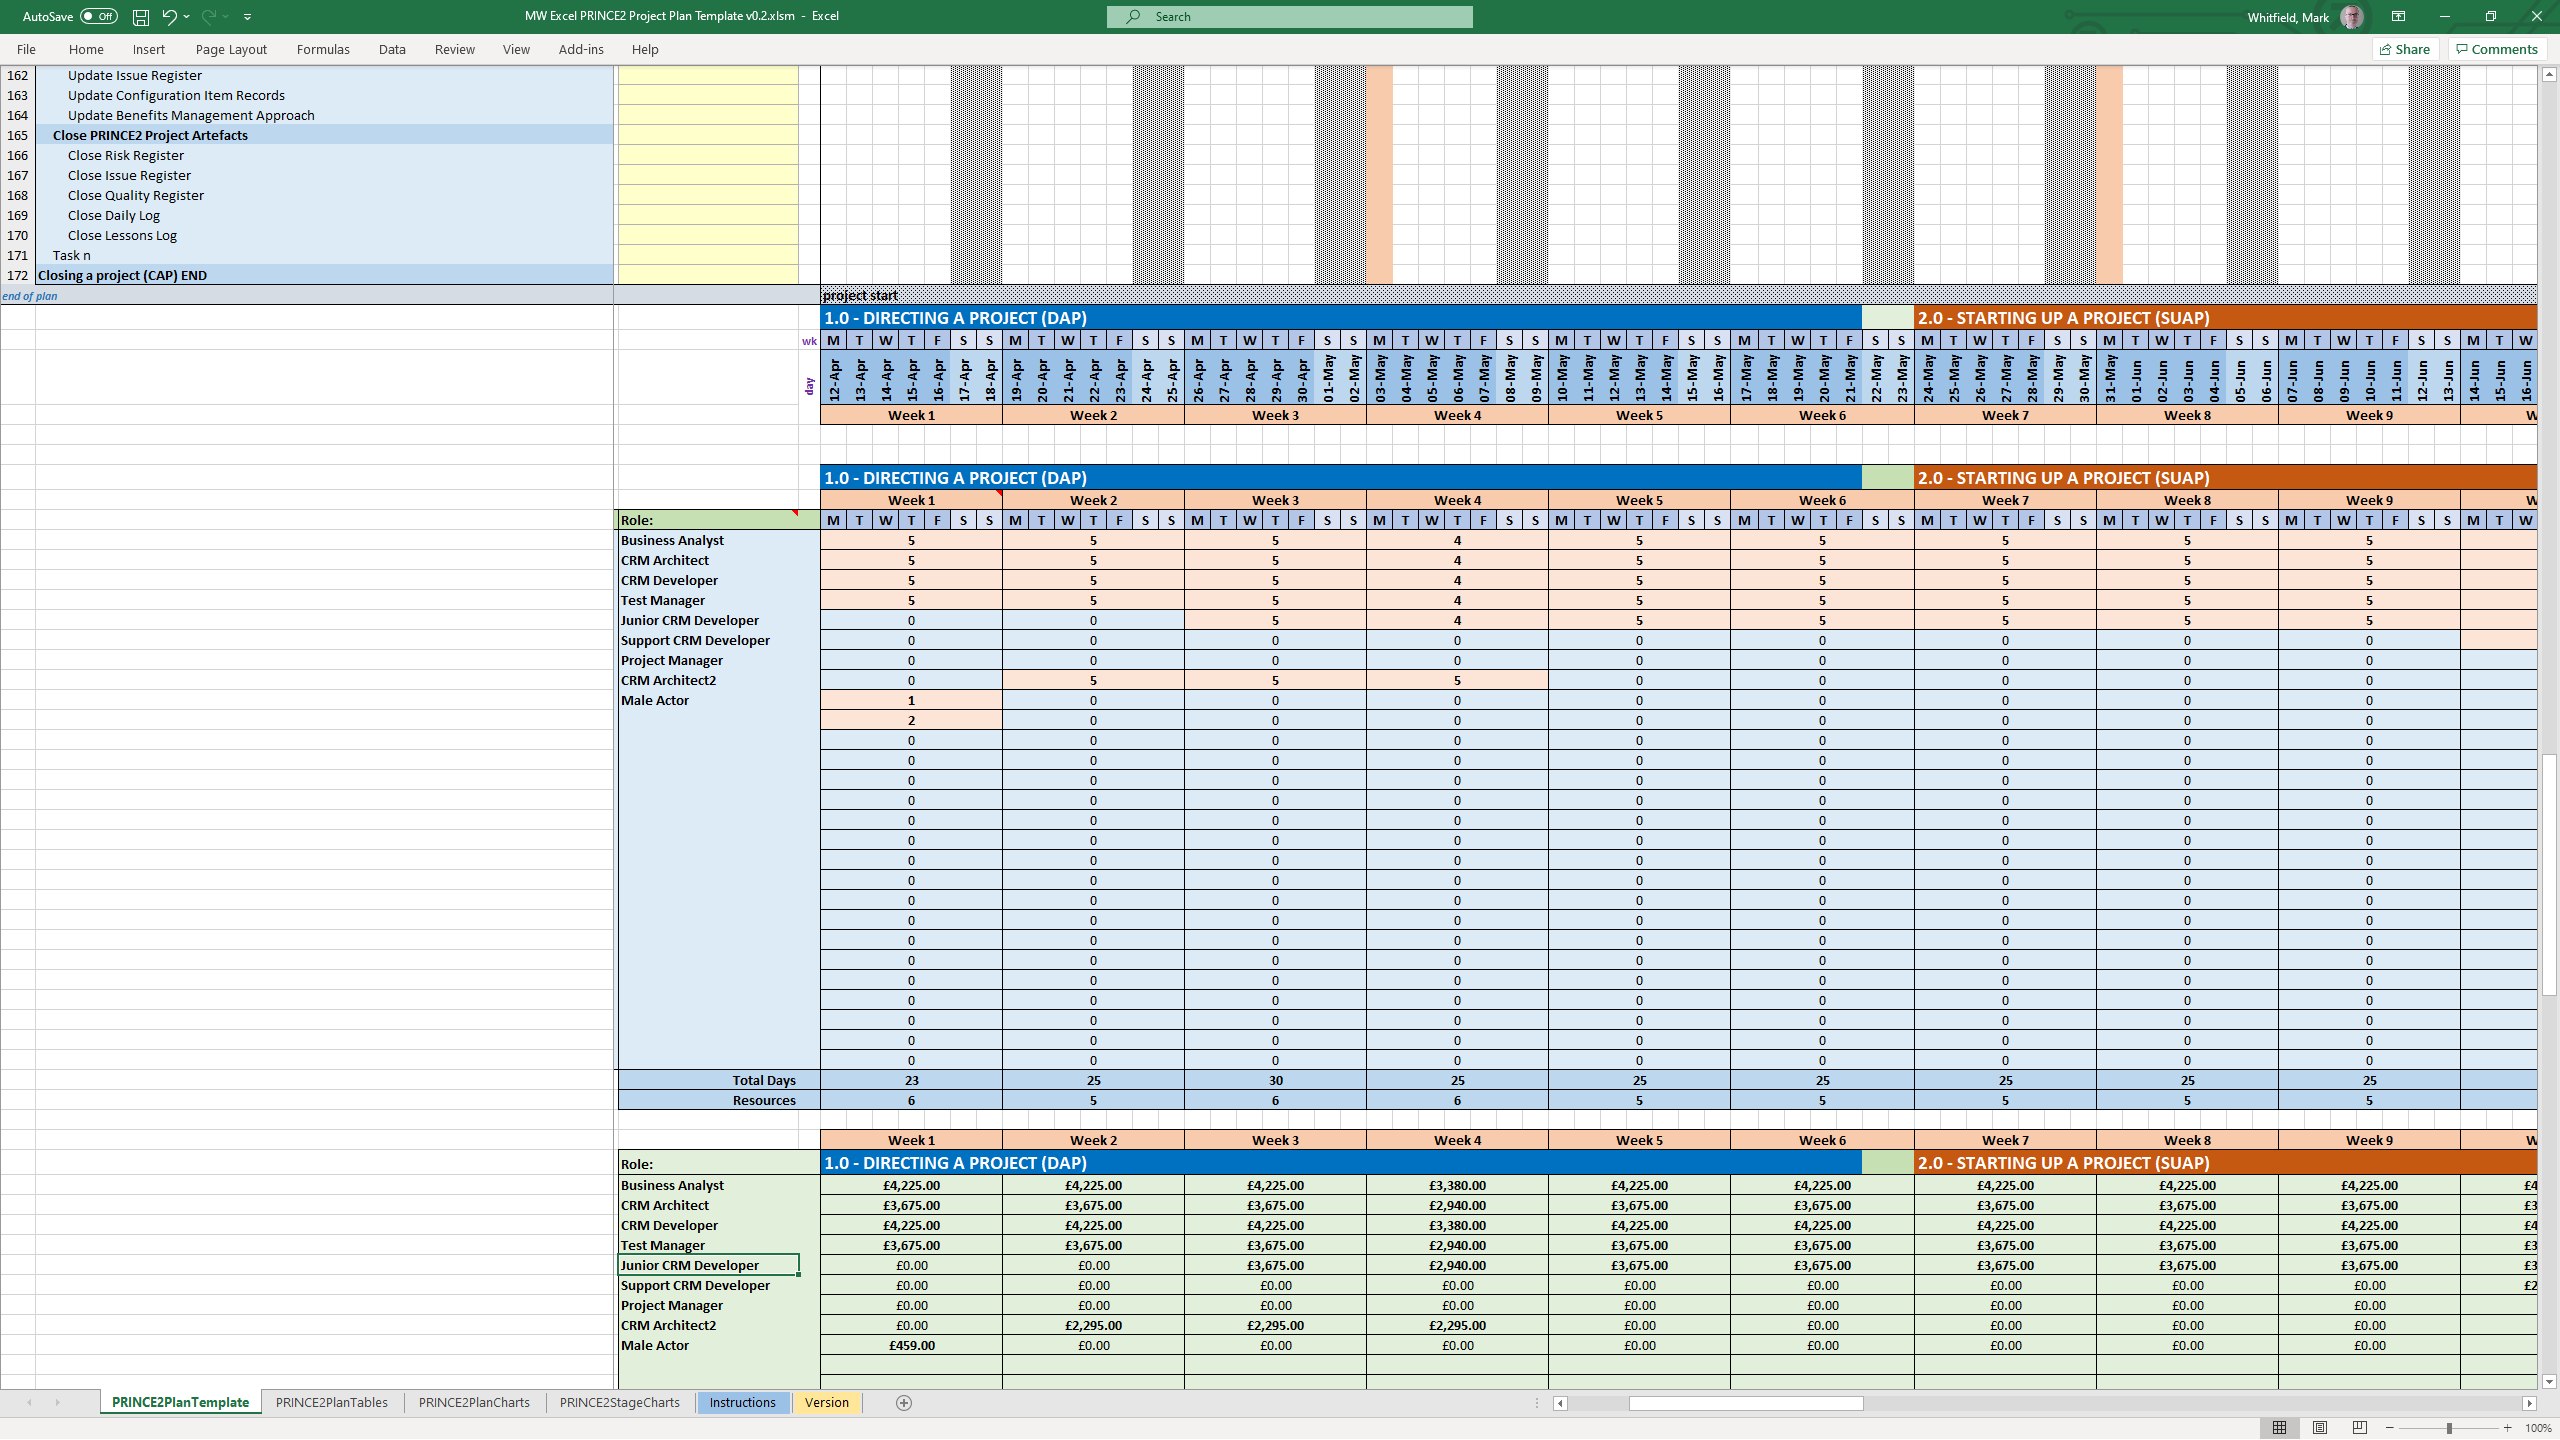
PRINCE2 project templates, Excel (.xls/.xlsm) & MS Project (.mpp) formats

You can find downloadable PRINCE2 project templates in Excel (.xls/.xlsm) and Microsoft Project (.mpp) formats across several specialized platforms. Because PRINCE2 is a highly structured methodology, standard templates usually map its specific processes (like Starting Up, Initiating, and Controlling a Stage) directly onto Gantt charts and tracking sheets.

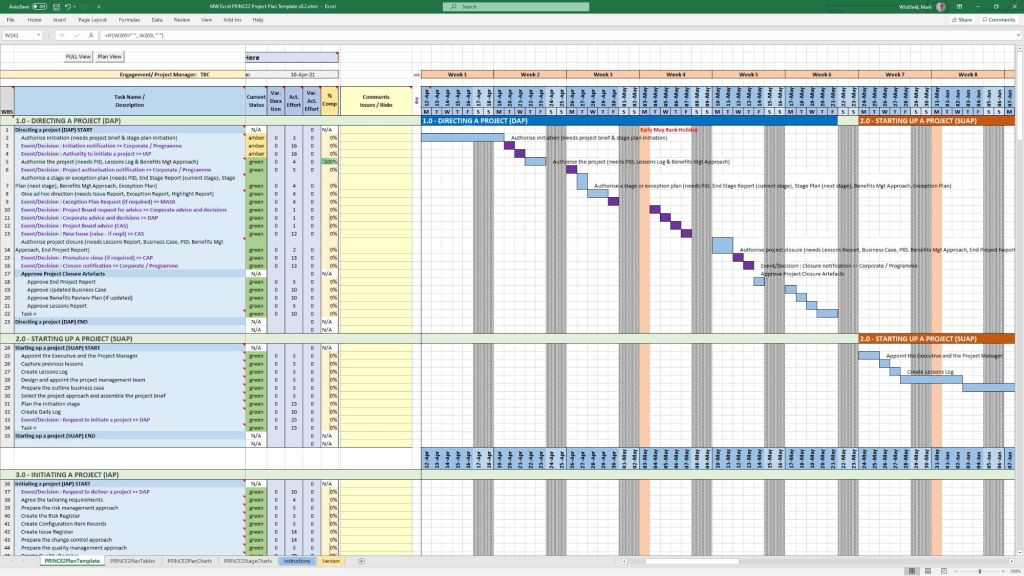
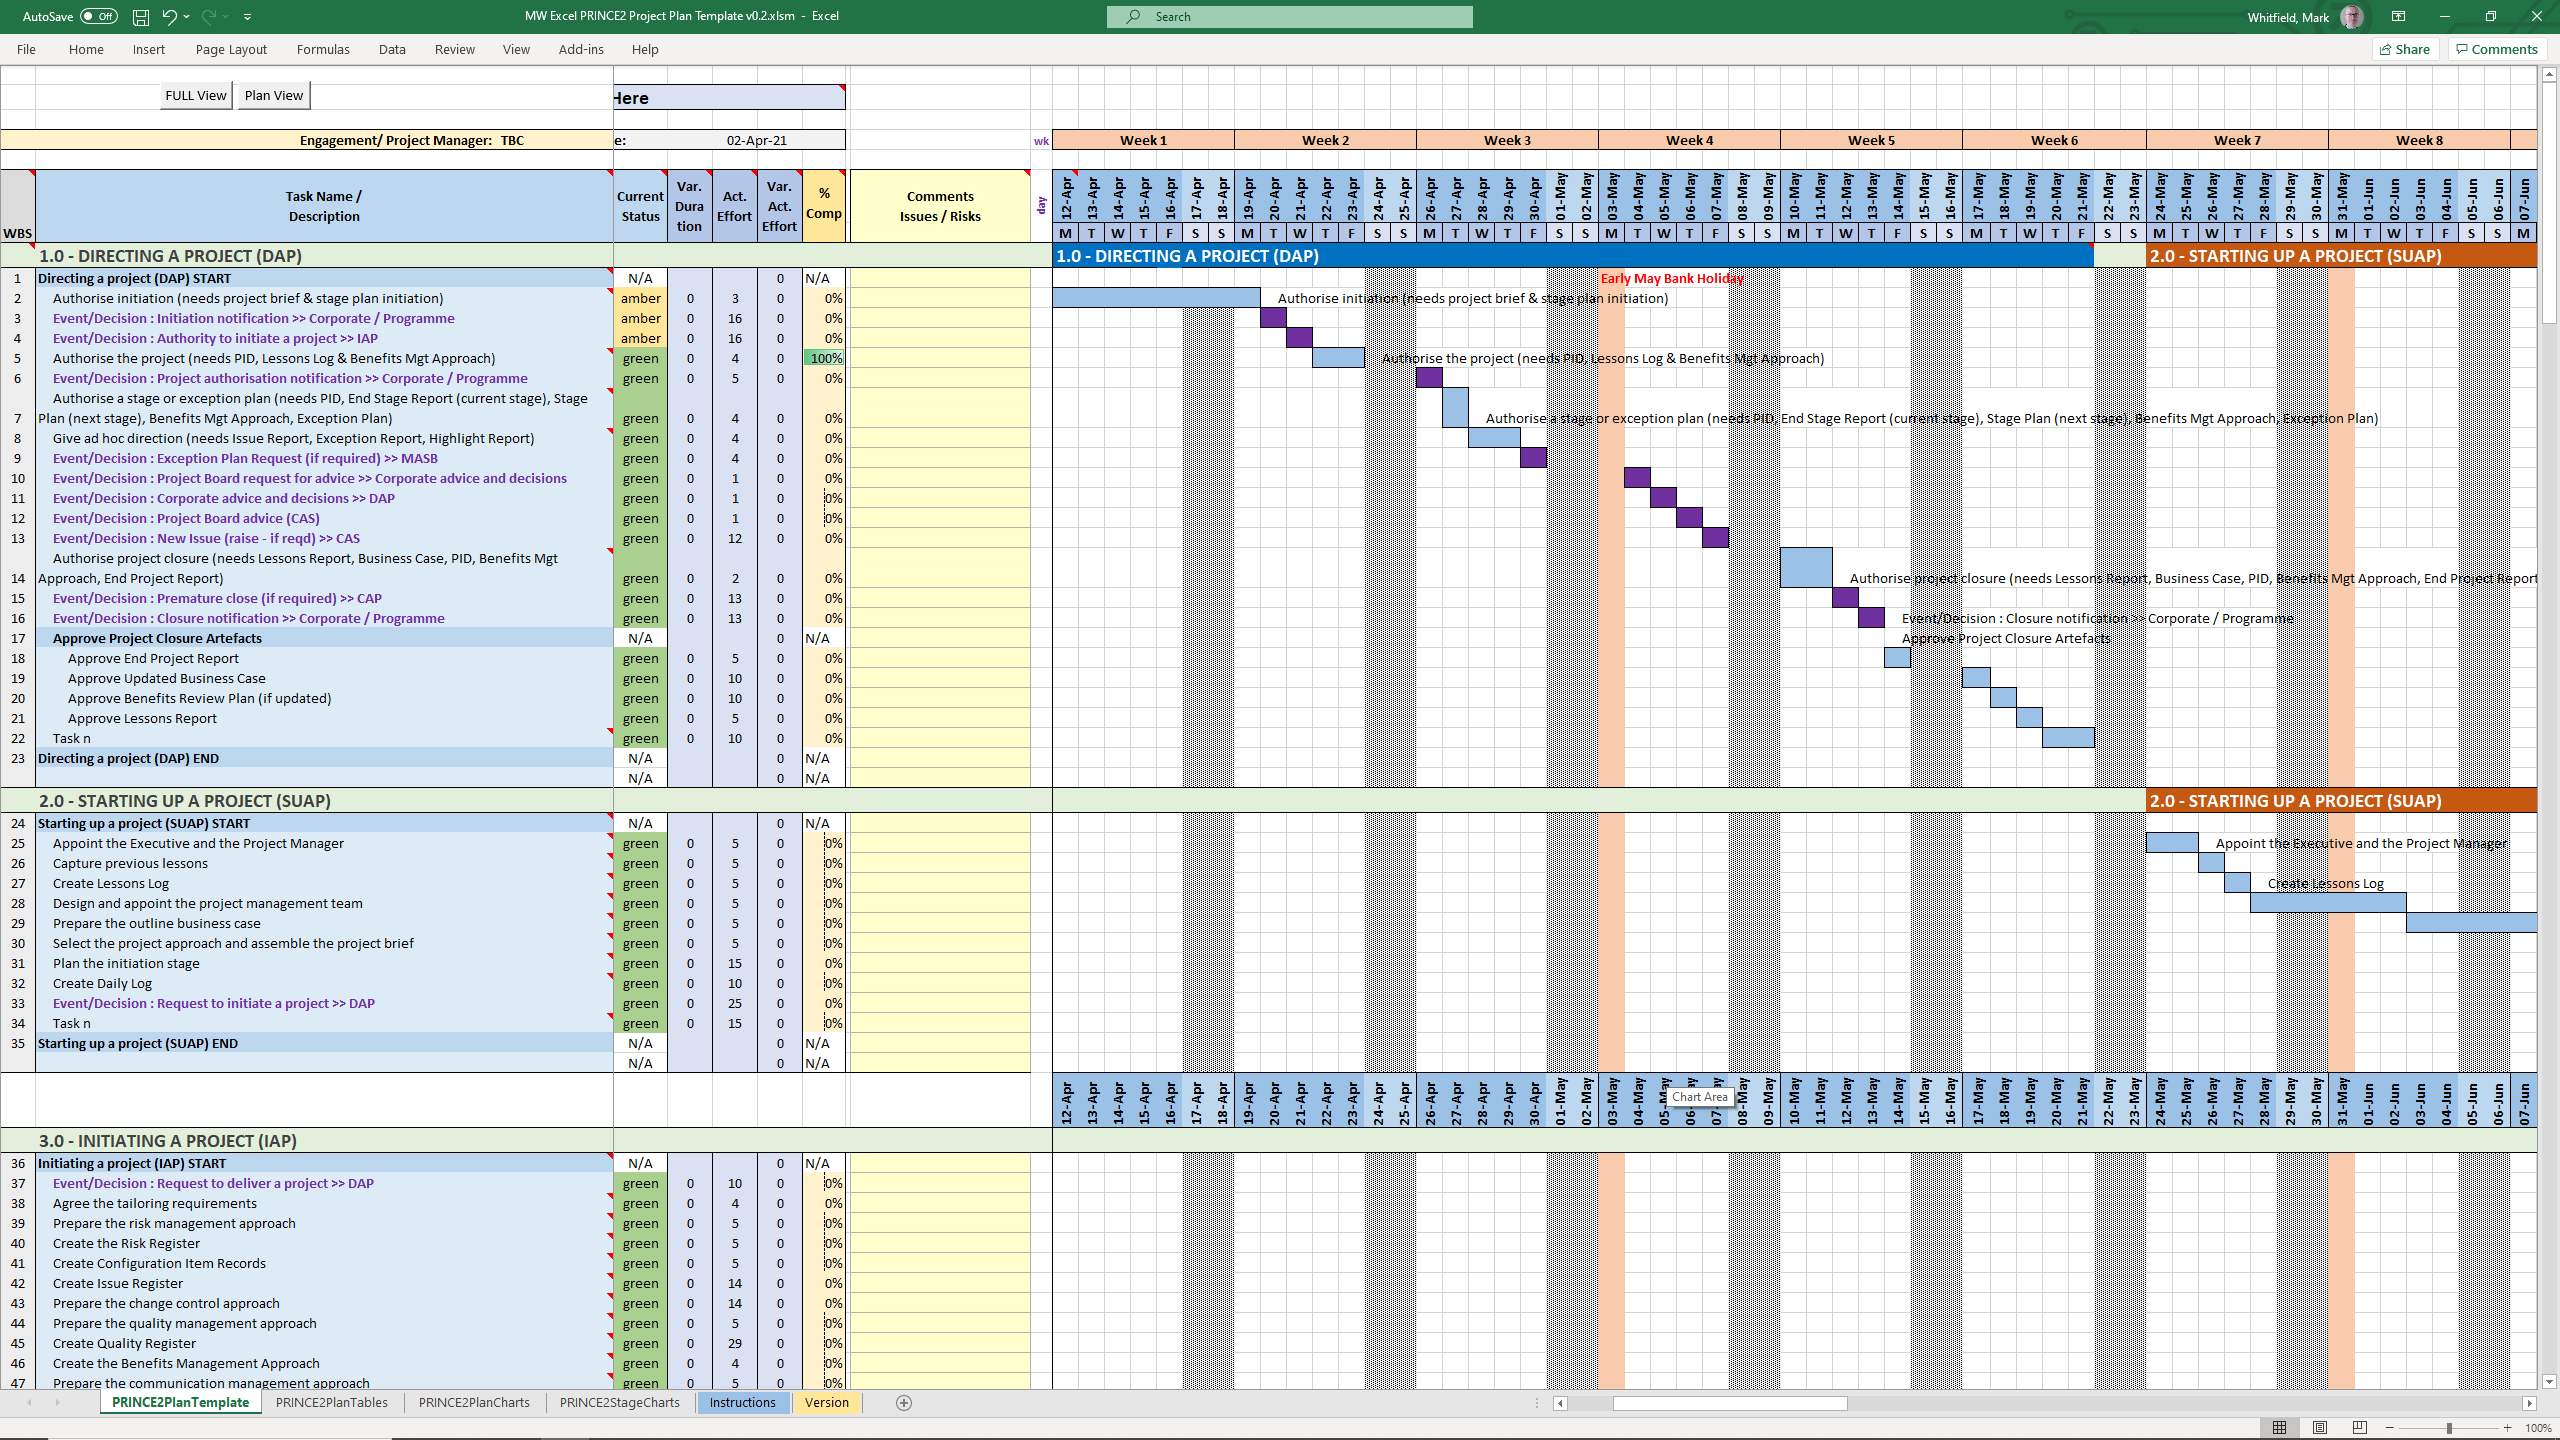
PRINCE2 MS Excel .xls plan in a spreadsheet
PRINCE2 MS Excel .xls plan
in a spreadsheet
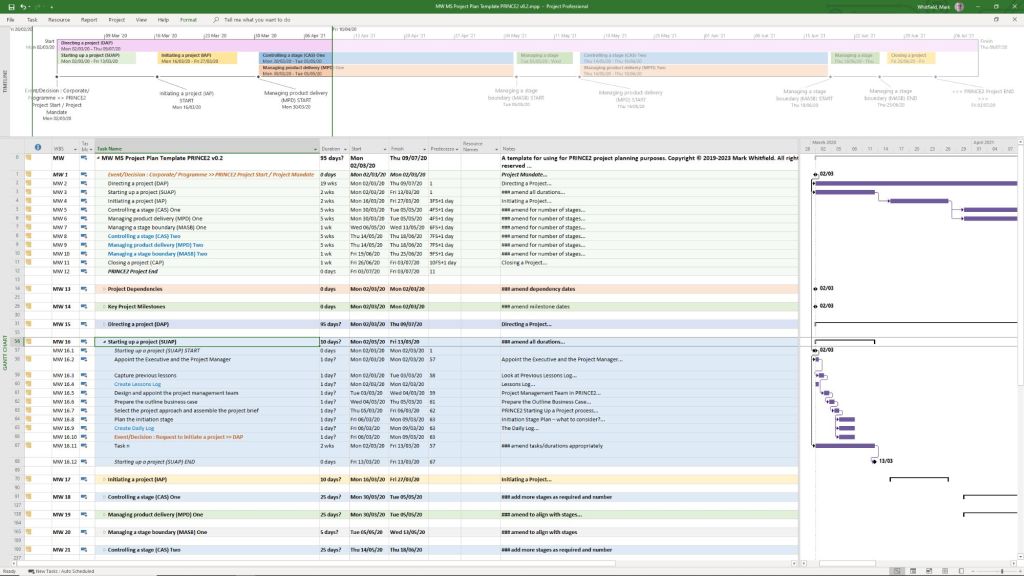
PRINCE2 MS Project .mpp plan in a project file
PRINCE2 MS Project .mpp plan
in a project file

The primary download options, ranging from premium practitioner bundles to free resource packages, are categorized below:

Comprehensive Premium Bundles (MPP & XLS)

If you require a fully integrated toolkit built specifically for the official PRINCE2 framework, individual project management practitioners offer comprehensive marketplace downloads:

  • Mark Whitfield PM Templates: Offers a dedicated seventh edition package including MW MS Project Plan Template PRINCE2 v0.2.mpp alongside its exact equivalent spreadsheet MW Excel PRINCE2 Project Plan Template v0.2.xlsm. You can download this Prince2 toolkit package plus others, on the Mark Whitfield Official Site or through the Mark Whitfield Etsy UK Shop.
  • Flevy Marketplace: Provides highly structured, professional enterprise files. You can purchase and download the PRINCE2 Templates + Microsoft Project MPP & MS Excel Document directly from their platform, which packs the MPP tracking timelines and XLSM / XLS sheets together.

PRINCE2 project templates, Excel (.xls/.xlsm) & MS Project (.mpp) formats

Microsoft Excel XLS PRINCE2 spreadsheet screenshots

Microsoft Excel XLS PRINCE Project Plan with Task Descriptions
Microsoft Excel XLS PRINCE Project Plan with Gantt View 1
Microsoft Excel XLS PRINCE Project Plan with Gantt View 2
Microsoft Excel XLS PRINCE Project Plan with Gantt View 3
Microsoft Excel XLS PRINCE Project Plan with Delivery Costings
Microsoft Excel XLS PRINCE Project Plan with Charts
Microsoft Excel XLS PRINCE Project Plan with PRINCE2 Stage Charts

Standard Artifacts Included in Download Packages

When downloading a comprehensive .zip toolkit, the package typically contains the core structural elements of the framework divided across your scheduling software:

  • MS Project (.mpp): A pre-constructed Prince2 waterfall delivery layout mapped with the 7 key PRINCE2 stages, built-in dependency workflows, milestone gates, and methodological prompts embedded in the task notes.
  • MS Excel (.xls/.xlsm): Mirrored project planning sheets (with costing) utilizing native formulas to auto-populate Gantt charts, alongside targeted operational spreadsheets like RAID logs (Risks, Assumptions, Issues, Dependencies), RACI matrix charts, resource trackers, and project budget tools.

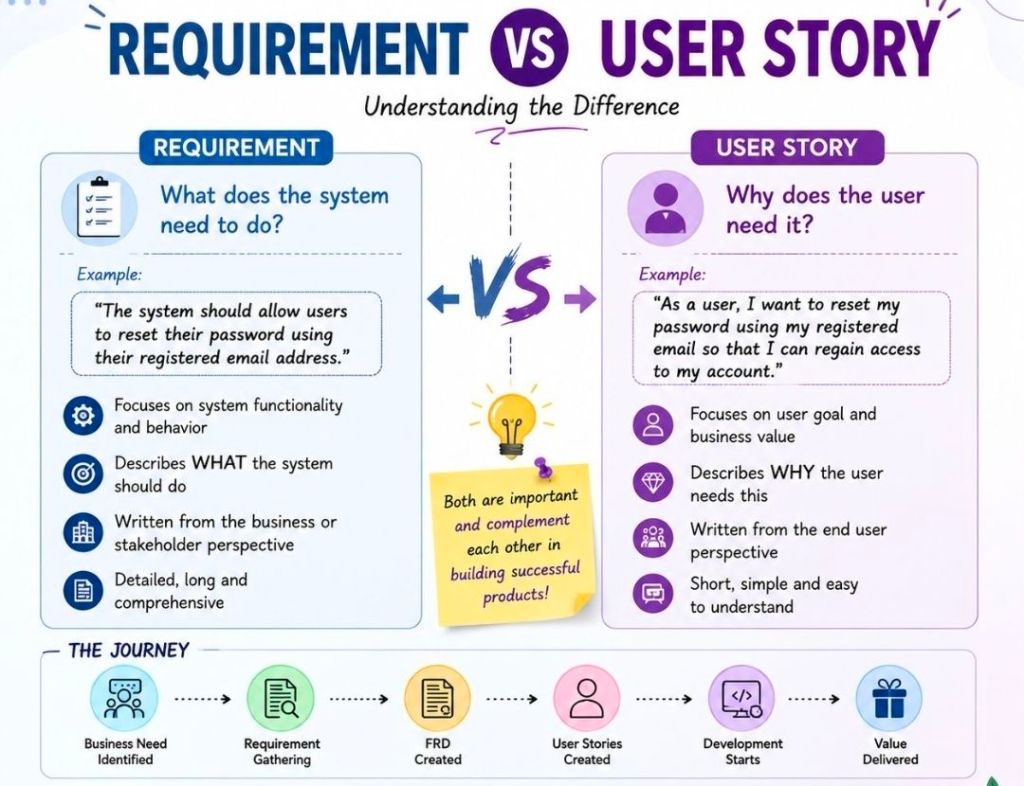
Requirement versus User Story

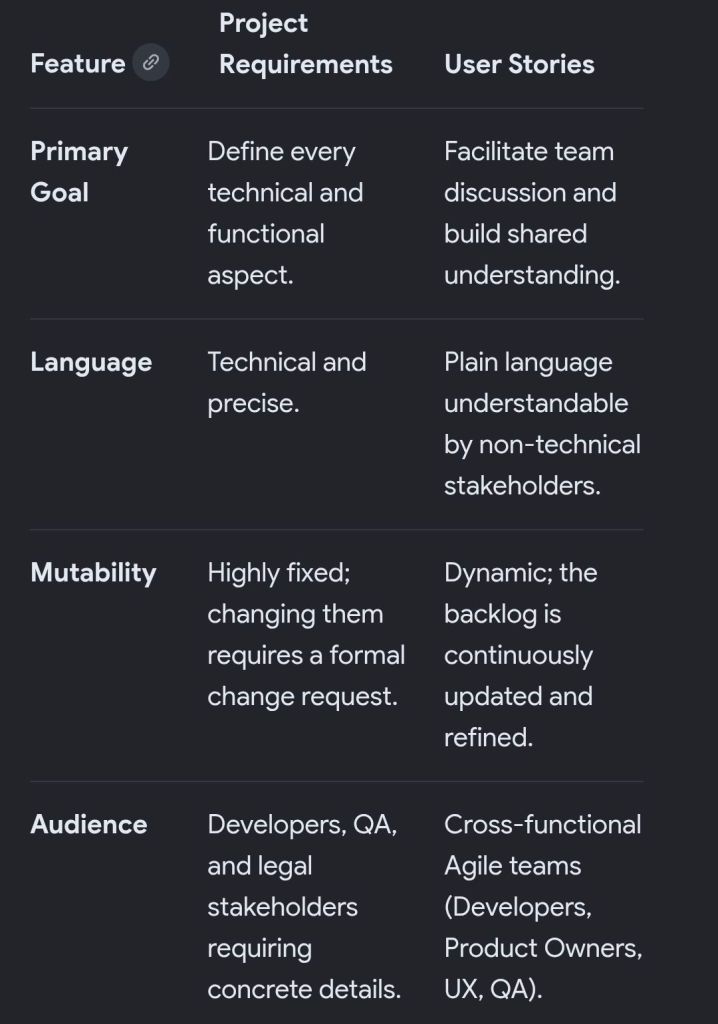
Project requirements are comprehensive, formal specifications describing what a system must do, usually written from the system’s perspective. User stories are short, lightweight descriptions of functionality written from the end-user’s perspective to drive team collaboration and conversation.

The distinction between these two approaches shapes how modern development teams capture scope and value.

Requirement versus User Story

Understanding Project Requirements

  • Focus: System functionality, technical constraints, and business rules.
  • Perspective: Written from the viewpoint of the system or product (e.g., “The system shall generate daily PDF reports.”).
  • Format: Heavy documentation, PRDs (Product Requirements Documents), spreadsheets, or flowcharts.
  • Methodology: Traditionally used in waterfall methodologies to define the scope comprehensively before any design or development begins.

Understanding User Stories

  • Focus: The user’s goal, business value, and the “why” behind a feature.
  • Perspective: Written from the viewpoint of the persona using the system (e.g., “As a Sales Manager, I want to review daily signups so that I can prioritize my sales calls.”).
  • Format: Short, often using the template: As a [User], I want to [Action], so that [Benefit]. Accompanied by Acceptance Criteria.
  • Methodology: An Agile-first tool. They are designed to act as an “invitation to a conversation” rather than a finalized contract.

Key Differences at a Glance

How They Work Together (The Hybrid Approach)

Most modern software development teams don’t abandon requirements entirely, but they shift the format. They use lightweight User Stories to represent the core value, and then pair them with technical Acceptance Criteria or supplementary design specifications to clarify the exact requirements the system must satisfy.

Requirement versus User Story