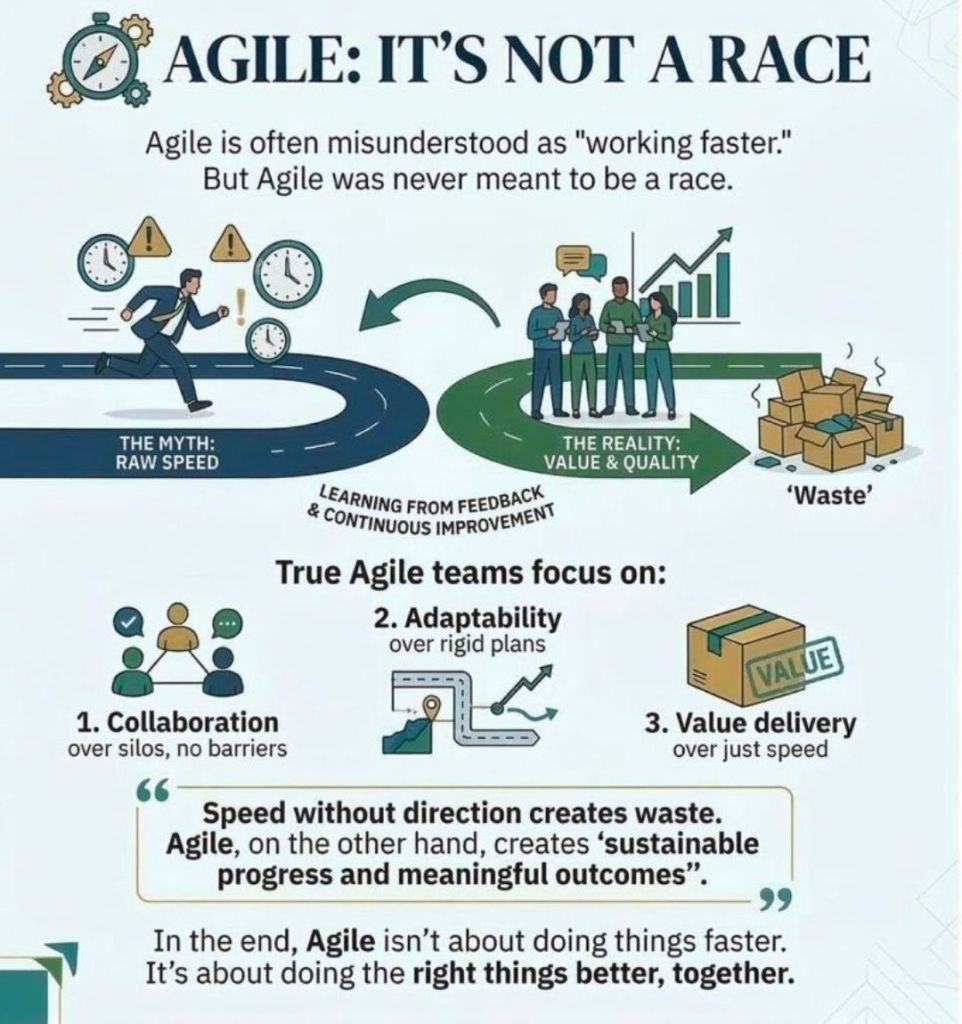
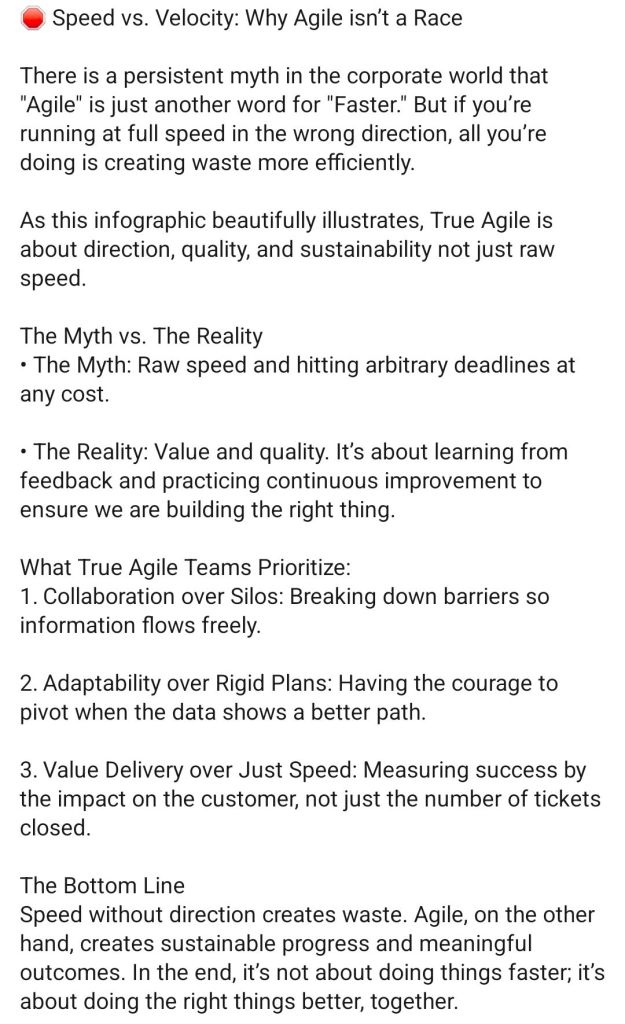
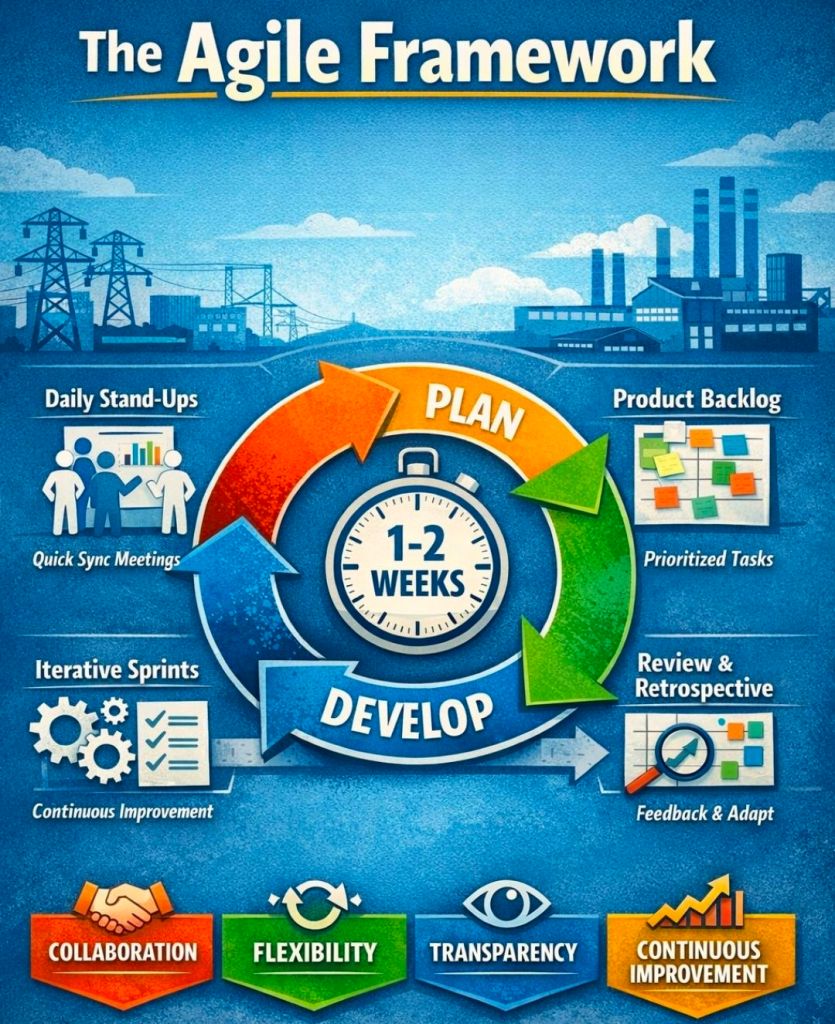
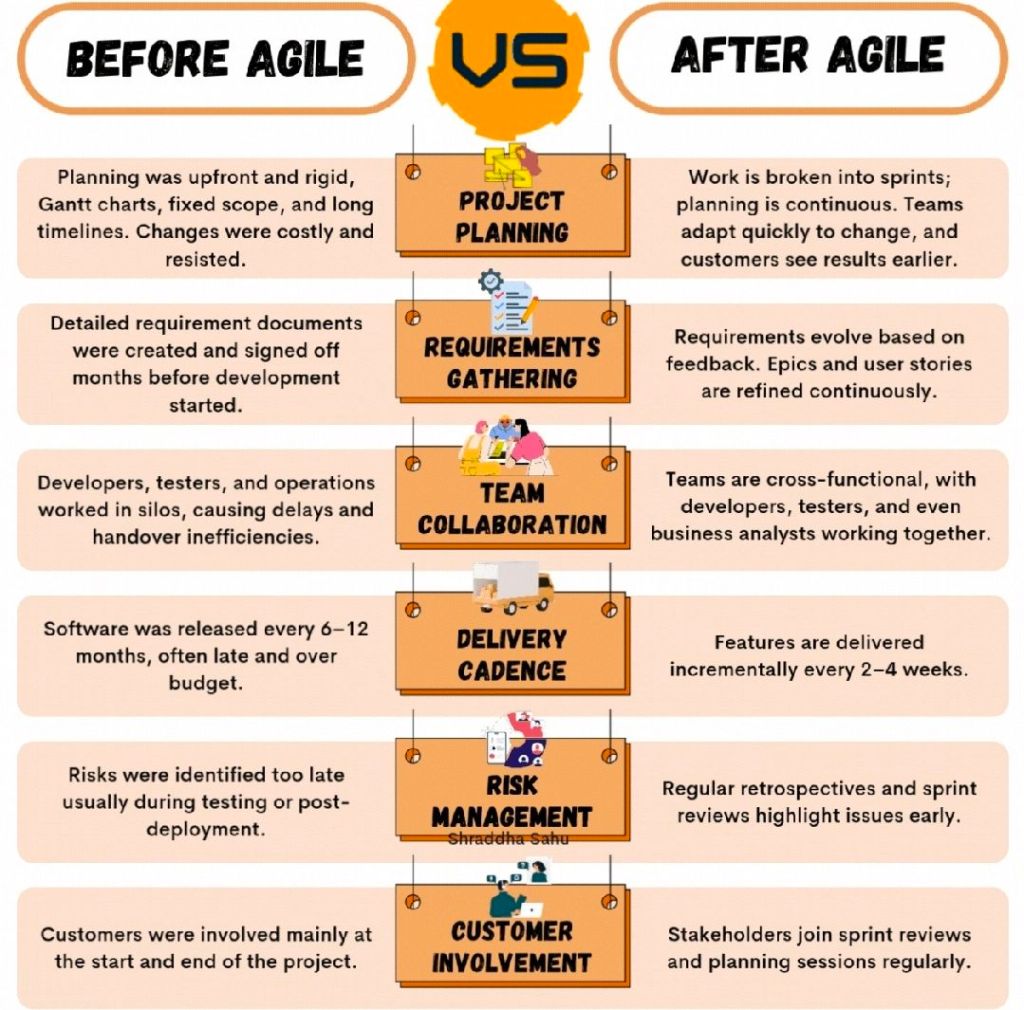
Agile development is an iterative and incremental approach to project management and software delivery that prioritises flexible planning, frequent delivery of working software, and rapid response to change. At its core, Agile seeks to shorten work cycles to deliver value to customers quickly while using frequent feedback to improve quality.
Core Overview
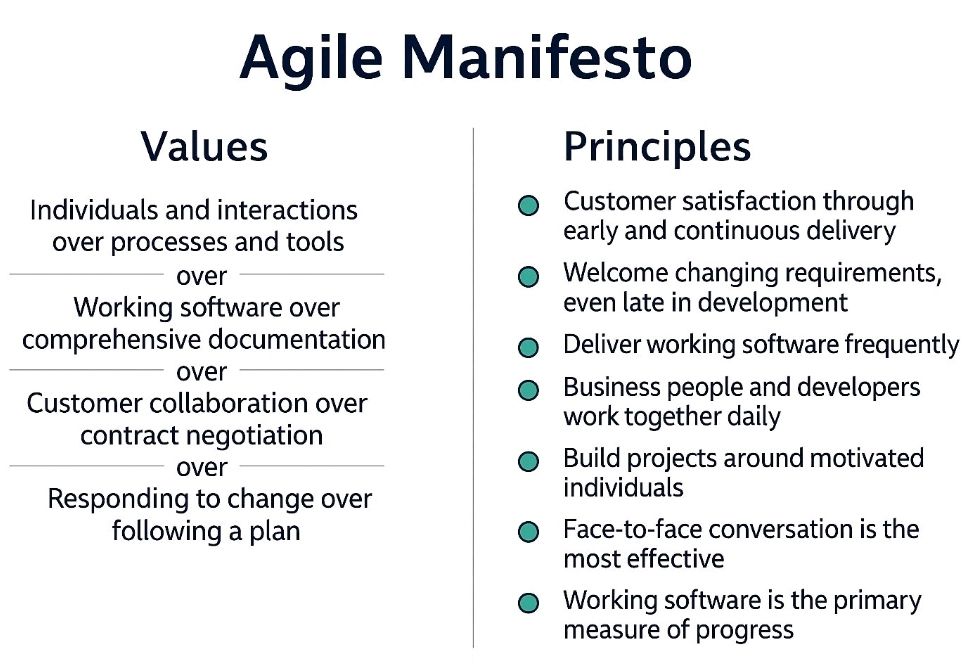
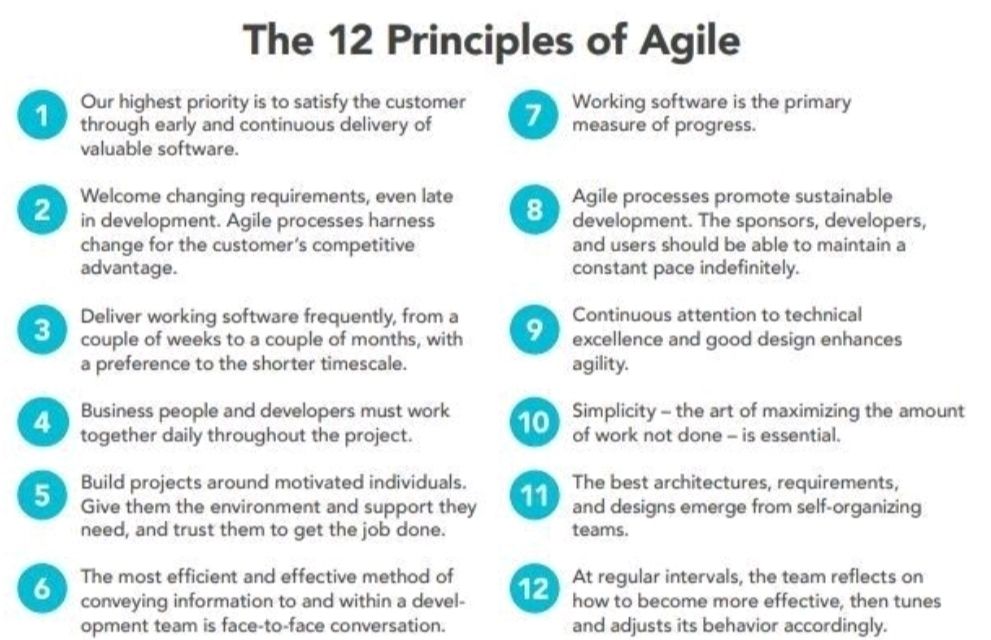
The foundation of modern Agile is defined by the Agile Manifesto (2001), which establishes four central values:
- Individuals and interactions over processes and tools.
- Working software over comprehensive documentation.
- Customer collaboration over contract negotiation.
- Responding to change over following a plan.
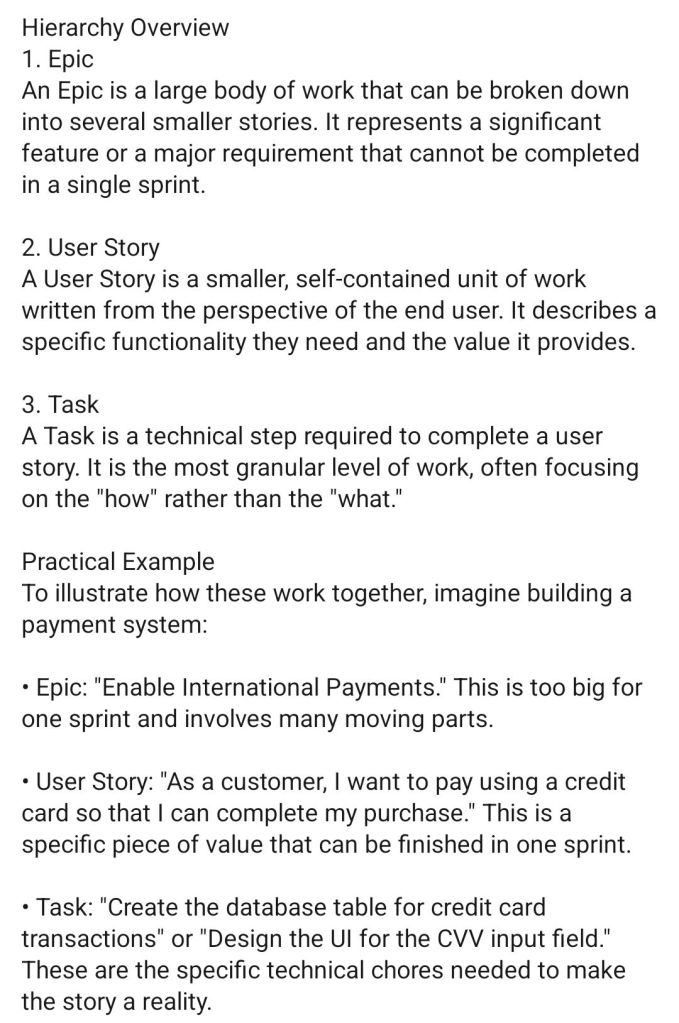
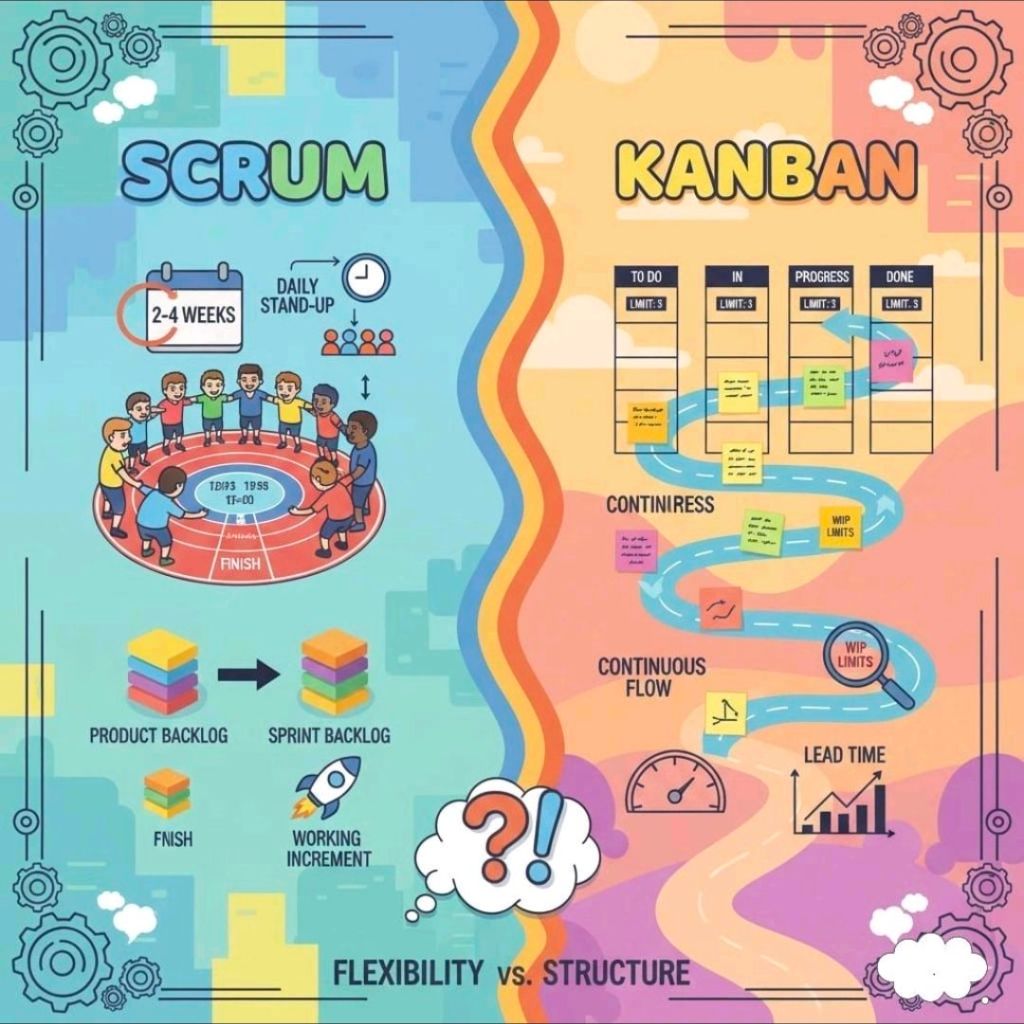
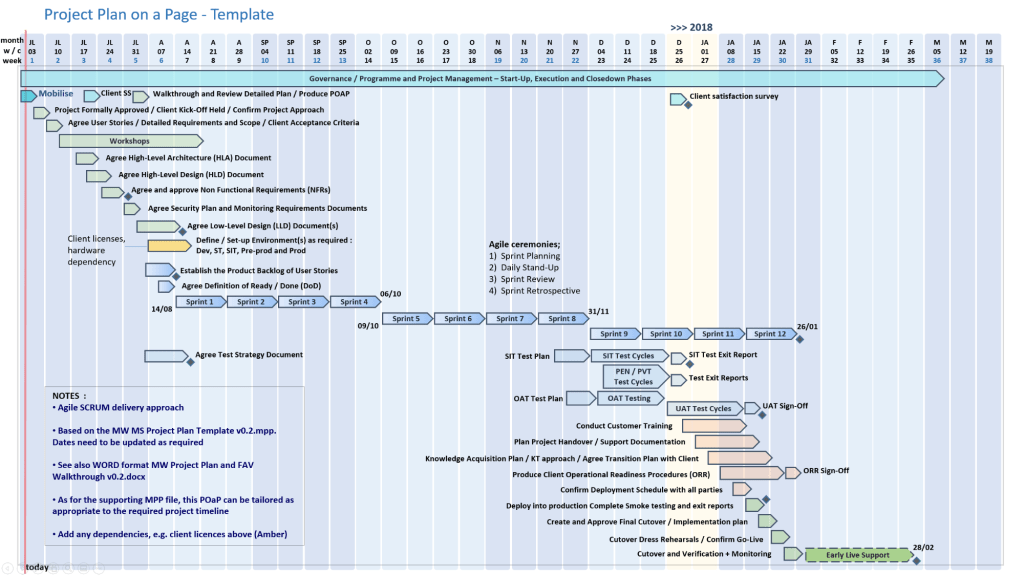
The Agile life cycle typically moves through six phases: Concept, Inception, Iteration, Release, Maintenance, and Retirement.
Comprehensive Timeline of Agile Development
Agile did not emerge in a vacuum; it evolved from early 20th-century industrial concepts and decades of experimentation in software engineering.
Era 1: The Industrial & Theoretical Roots (1910s – 1960s)
This era established the foundational concepts of efficiency, waste reduction, and iterative cycles that would later inform Agile frameworks.
- 1911: Frederick Taylor publishes The Principles of Scientific Management, advocating for managers to analyse and adopt worker-led process improvements.
- 1930s: Walter Shewhart at Bell Labs develops the Plan-Do-Check-Act (PDCA) cycle, a groundbreaking iterative methodology for quality control.
- 1948: Toyota formalises the Toyota Production System (Lean), introducing concepts like Kaizen (continuous improvement) and Just-in-Time manufacturing.
- 1957: Gerald Weinberg and others at IBM begin using incremental development on projects.
- 1958: NASA’s Project Mercury uses half-day iterations and test-first development, marking one of the earliest high-stakes uses of iterative cycles.
Era 2: Evolutionary Alternatives to Waterfall (1970s – 1980s)
As the rigid Waterfall model became dominant, practitioners began developing “lightweight” alternatives to handle complex, shifting requirements.
- 1970s: Barry Boehm proposes Wideband Delphi, an early forerunner to Planning Poker.
- 1976: Tom Gilb publishes the Evolutionary Delivery Model (Evo), perhaps the first explicitly named incremental alternative to Waterfall.
- 1980: Toyota introduces Visual Control, the predecessor to Agile “information radiators” like Kanban boards.
- 1986: Hirotaka Takeuchi and Ikujiro Nonaka publish “The New New Product Development Game” in Harvard Business Review, introducing the “rugby” approach that inspired the Scrum framework.
- 1988: Barry Boehm formalises the Spiral Model, an iterative model focused on identifying and reducing risks.
Era 3: The Proliferation of Frameworks (1990 – 2000)
This decade saw a “crisis” in software development where traditional methods failed to keep up with the personal computing boom, leading to the birth of modern frameworks.
- 1991: James Martin publishes Rapid Application Development (RAD), formalising the use of timeboxing and iterations.
- 1993: Jeff Sutherland and team at Easel Corporation first implement Scrum as a formal process.
- 1994: The Dynamic Systems Development Method (DSDM) is created as a non-profit consortium to provide a framework for RAD.
- 1995: Ken Schwaber and Jeff Sutherland co-present the Scrum methodology at the OOPSLA conference.
- 1996: Kent Beck creates Extreme Programming (XP) while working on the Chrysler Comprehensive Compensation (C3) project.
- 1997: Jeff De Luca introduces Feature-Driven Development (FDD).
- 1999: Kent Beck publishes Extreme Programming Explained, popularising many engineering practices like pair programming.
Era 4: The Manifesto & Mainstream Adoption (2001 – 2010)
Agile shifted from a niche experimental approach to a global industry standard.
- 2001 (Feb): 17 developers meet at Snowbird, Utah, and author the Manifesto for Agile Software Development.
- 2001 (Post): The Agile Alliance is formed to promote the manifesto’s values.
- 2003: Mary and Tom Poppendieck publish Lean Software Development, formally linking Lean manufacturing principles to Agile.
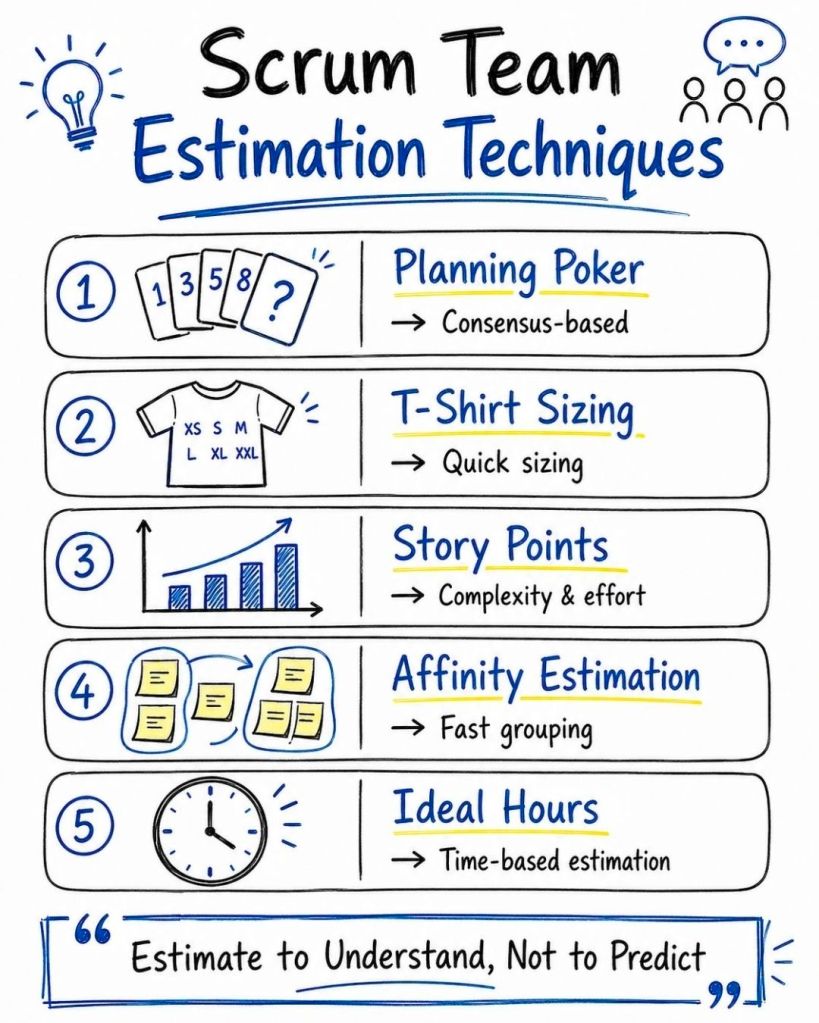
- 2005: Mike Cohn introduces Planning Poker in Agile Estimating and Planning.
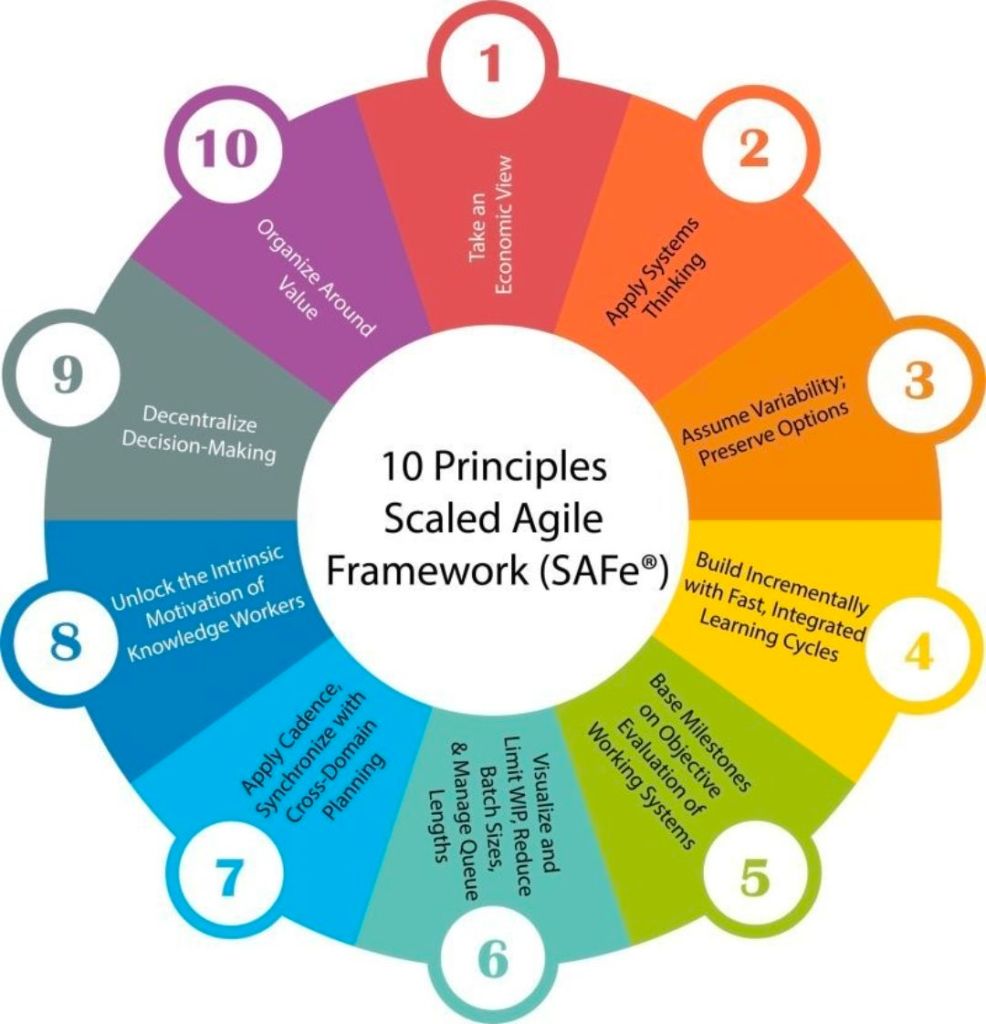
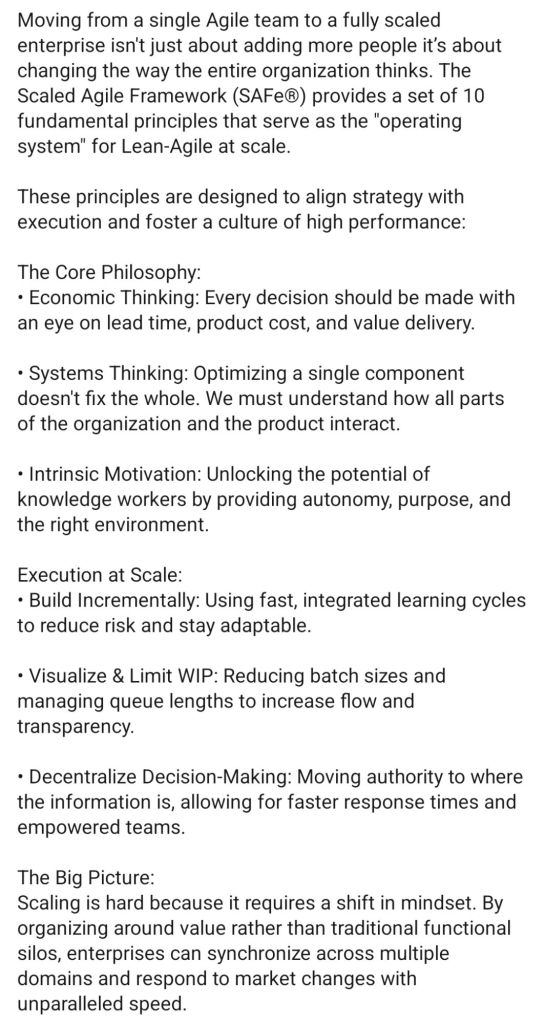
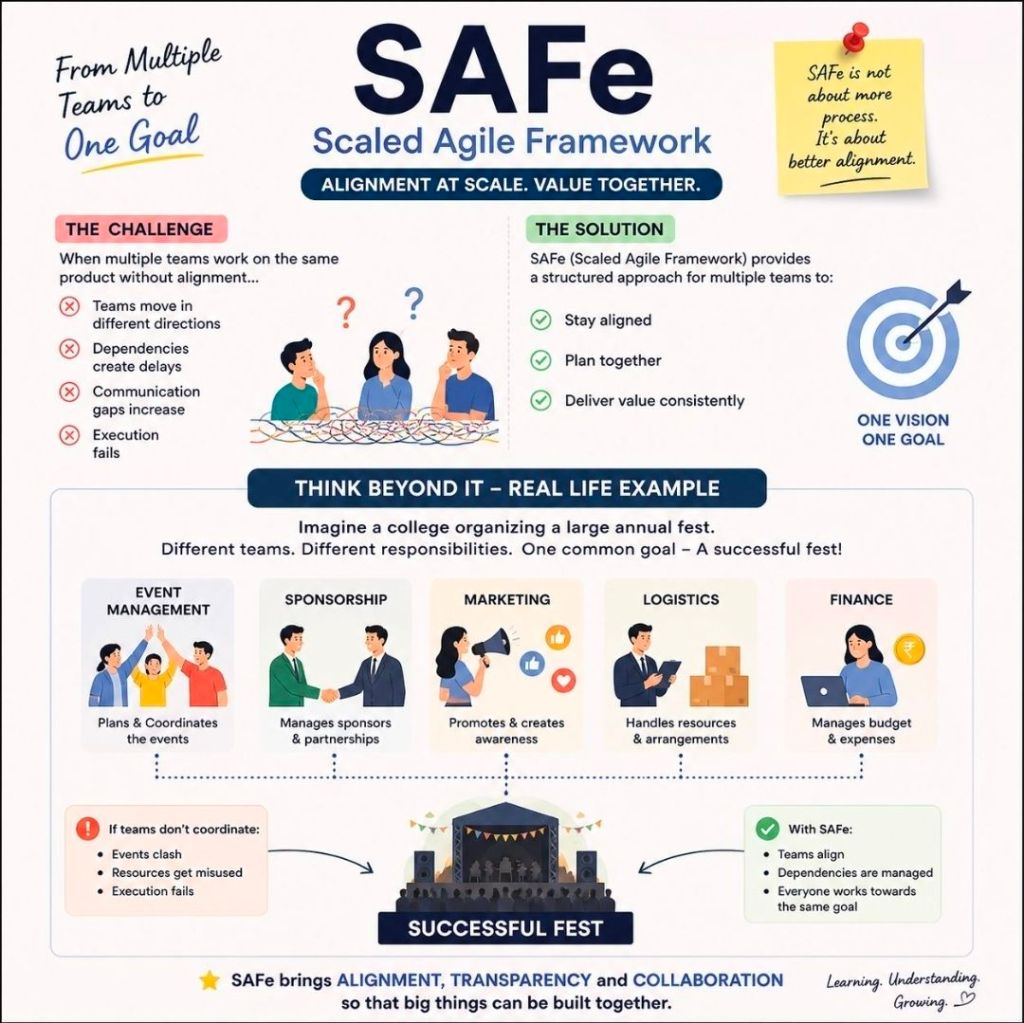
- 2007: The Scaled Agile Framework (SAFe) is introduced by Dean Leffingwell to apply Agile to large enterprises.
- 2009: The concept of DevOps emerges, seeking to bridge the gap between Agile development and IT operations.
Era 5: Scale, Transformation, and Modern Evolution (2011 – Present)
Agile has expanded beyond software into marketing, HR, and education, becoming a “culture” rather than just a tool.
- 2011: The Project Management Institute (PMI) introduces the Agile Certified Practitioner (PMI-ACP).
- 2012–2015: Agile adoption surpasses 50% in the development world as success metrics become undeniably clear.
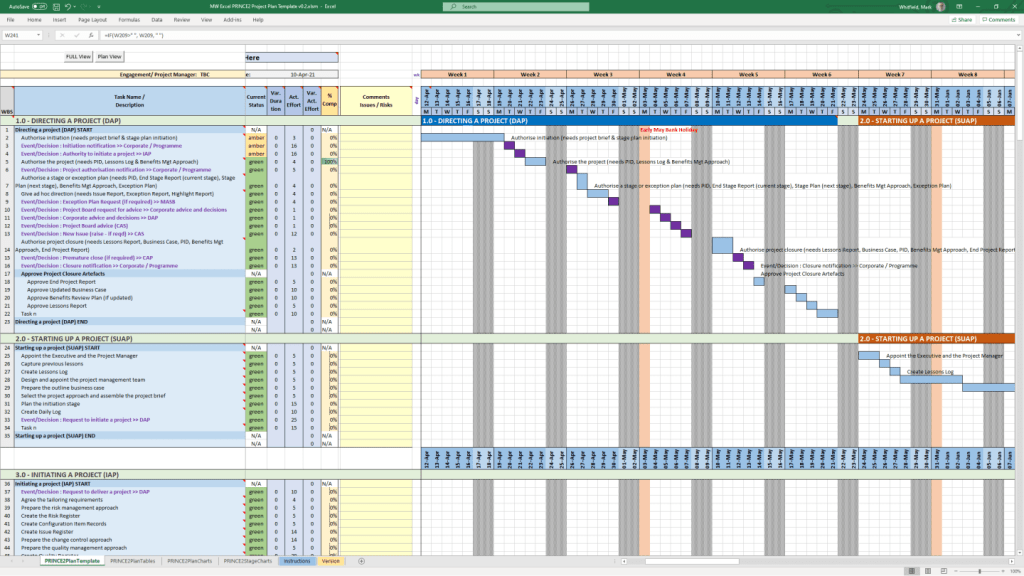
- 2017: AXELOS updates PRINCE2 to make agility a core focus of the project management standard.
- 2020s: Continued evolution toward “Business Agility,” where entire organisations adopt Agile mindsets to survive rapidly changing market conditions.
Agile Development Overview and Detailed Timeline by Era