Download Templates for PROject Management | FREE Upgrades & Additions
Author: Mark Whitfield
Welcome to my site!
After graduating in Computing in 1990, I accepted a position as a programmer at a Runcorn based software house specialising in electronic banking software, namely sp/ARCHITECT-BANK on Tandem Computers (now HPE NonStop). This was before the internet became more prevalent and so the notion of enabling desktop access to company accounts for inter-account transfers and book keeping was still quite a cutting edge idea (and smartphones only ever hinted at in Space 1999). The company was called The Software Partnership (which was taken over by Deluxe Data in 1994).
I spent 5 years in Runcorn developing code for SP/ARCHITECT for various banks like TSB, Bank of Scotland, Rabobank and Girofon (Denmark) to name but a few. I then moved onto a software house in Salford Quays for further bank facing projects. After a further 23 years in the IT industry and now a Senior IT Project Manager (both Agile and Waterfall delivery), I thought I would echo out my Career Profile in this corner of the internet for quick and easy access.
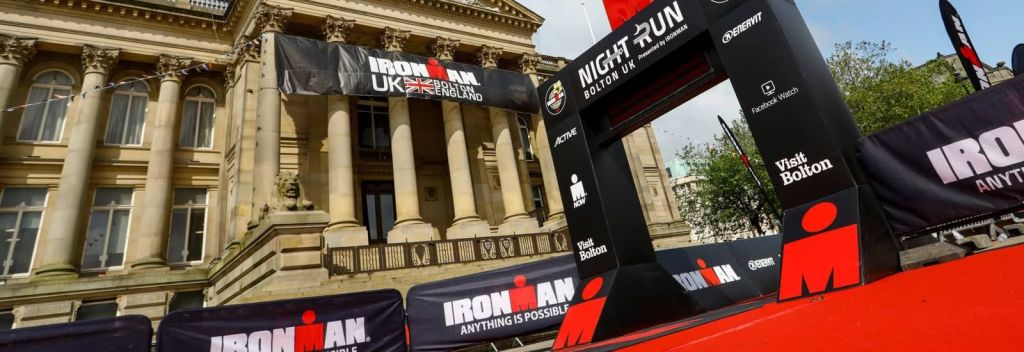
The IRONMAN 70.3 Bolton is the UK’s standout early-summer middle-distance triathlon, featuring a 1.2-mile lake swim, a 56-mile hilly bike ride, and a 13.1-mile town center run. The event has a legendary electric finish in the heart of Bolton on Victoria Square.
2026 IRONMAN 70.3 Bolton
Event Profile
Date: Sunday, June 7
Format: Age-group and professional categories, featuring a self-seeded rolling swim start.
Energy Partner:Maurten Gels are available on-course for athlete fueling.
Bike (56 Miles / 90 km): A two-loop circuit around the surrounding regions before heading north into the Lancashire Moors. It is known to be a challenging, undulating ride with some technical sections.
Run (13.1 Miles / 21.1 km): A mostly flat, two-loop half marathon through Queens Park and the historic streets of Bolton.
Spectator Information & Logistics
Finish Line: The final stretch leads competitors down the Red Carpet toward the steps of the Bolton Town Hall.
Road Closures: Extensive road closures and bus diversions affect the area, with major impacts on roads and surrounding routes.
Local Amenities: Spectators and athletes have access to local hubs like the Albert Halls Bolton and the Bolton Museum, both located right near Victoria Square.
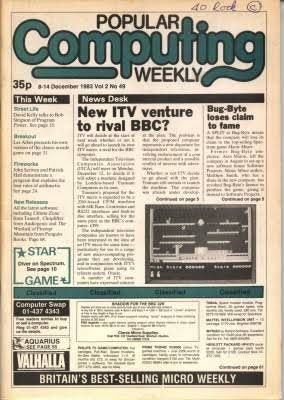
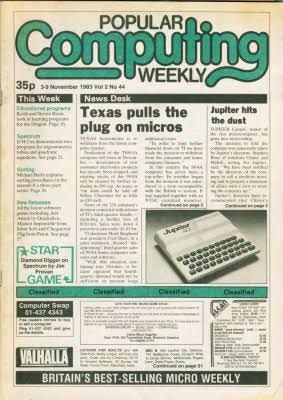
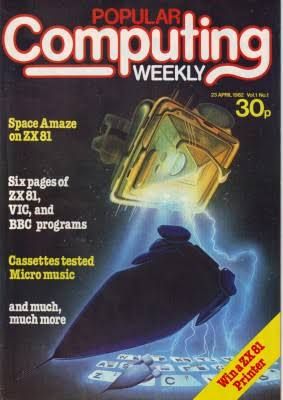
Popular Computing Weekly (frequently abbreviated as PCW) was a highly influential British computer magazine published from 23 April 1982 to 14 June 1990.
Popular Computing Weekly British Computer Magazine from 1982 thru 1990
Launched by Sunshine Publications and led by founding editor Duncan Scot, it stood out by providing rapid-fire weekly news, hardware reviews, type-in software programs, and gaming coverage at the height of the UK’s home microcomputer boom.
Over its eight-year lifespan, it produced 415 issues, adapting its identity from a broad hobbyist guide to a gaming-centric publication before closing in the early 1990s.
Magazine Overview & Core Elements
Unlike glossy monthly publications such as Personal Computer World or Your Computer, Popular Computing Weekly acted as a fast-paced “newspaper” for the UK micro community. Because it hit newsagent shelves every seven days, it could report on dramatic price drops, industry buyouts, and hardware delays weeks before monthly rivals.
The magazine catered to a wide array of early systems, including the ZX Spectrum, Commodore 64, BBC Micro, Amstrad CPC, Atari 8-bit, Dragon 32, VIC-20, and later the 16-bit machines. Its format generally consisted of:
News Desk: Urgent industry reporting, micro-market trade wars, and launch delays.
Hardware and Software Reviews: Critical evaluations of new home computers and software titles.
Type-In Listings: Pages of raw BASIC or Machine Code that readers meticulously copied into their systems to run games and utilities.
Gaming Coverage & Puzzles: Dedicated spaces for arcade game high scores, maps, and adventure hints.
Detailed Timeline Breakdown (1982–1985)
1982: Launch and the 8-Bit Explosion
April: On 23 April 1982, Issue 1 was published by London-based Sunshine Publications. The launch editor, Duncan Scot, managed the first 8 issues before handing the reins over to Brendon Gore.
May–June: The magazine’s debut directly coincided with Sir Clive Sinclair’s unveiling of the ZX Spectrum. Popular Computing Weekly quickly positioned itself as a critical hub for Spectrum and BBC Micro setup guides and technical support.
System Agnosticism: Early volumes accommodated a highly fractured market, including type-in listings for the ZX81, VIC-20, Acorn Atom, TRS-80, and early Apple II systems.
Cover Price: The early issues cost just 30p.
1983: Price Wars and Rising Circulation
The Boom Year: Home computing exploded in the UK. PCW capitalised on its fast turnaround to report on brutal, ongoing price slashes initiated by Commodore, Sinclair, and Atari.
Market Diversification: Content expanded heavily to track new contenders like the Oric-1, Dragon 32, and the newly launched Commodore 64.
Commercialisation: Software companies grew rapidly. Advertising pages surged with multi-page spreads from early publishing giants like Imagine Software, Ocean Software, and Ultimate Play The Game.
1984: Amstrad’s Arrival and Market Shocks
April: The magazine closely documented Alan Sugar’s entry into the computer market with the Amstrad CPC 464, which changed the landscape by packaging a computer, keyboard, and monitor into an all-in-one unit.
The Crash Warning: PCW reported extensively on the high-profile financial collapse of Imagine Software and structural corrections across the British software industry.
The MSX Standard: The magazine devoted substantial print space to tracking the arrival of Japanese MSX standard computers (such as Toshiba’s HX-10) attempting to break into the UK.
1985: Transition to 16-Bit and Gaming Domination
January: The magazine followed the rocky release of the business-oriented Sinclair QL and the debut of the dual-mode Commodore 128.
May: The news desk shifted focus to the 16-bit horizon, tracking early announcements for the Atari 520ST and Commodore Amiga.
Pricing: Driven by inflation and increased page counts, the cover price rose to 40p.
Software Pivot: As users grew tired of typing in complex code by hand, the publication reduced its raw code listings and pivoted towards dedicated, full-colour video game previews, software reviews, and maps.
Post-Early Eighties Legacy (1986–1990)
Beyond its golden era, the publication continued to evolve through the late 1980s. By 1989, regular home micro content declined as the industry consolidated around IBM-compatible PCs, the Amiga, and the Atari ST. To compensate for falling sales, PCW incorporated Computer Gamesweek in 1989, morphing almost entirely into a video games magazine.
1. Popular Computing Weekly British Computer Magazine from 1982 thru 1990
2. Popular Computing Weekly British Computer Magazine
Sunshine Publications eventually closed the magazine on 14 June 1990 with its 415th issue, ending its run as a primary historical record of the 1980s British microcomputing phenomenon.
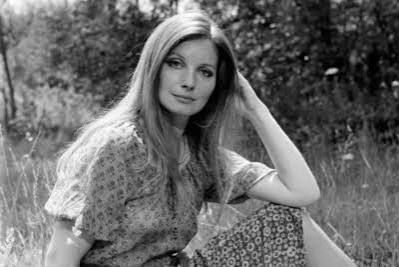
Catherine Schell is an internationally acclaimed Hungarian-born British actress celebrated for her commanding presence and versatility across mainstream cinema, comedy, and British cult television.
Catherine Schell
Best known for her iconic roles as the shape-shifting alien Maya in Space: 1999, the glamorous Lady Claudine Litton in The Return of the Pink Panther, and a Bond girl in On Her Majesty’s Secret Service, she seamlessly navigated international franchises, sci-fi cult classics, and intense television dramas.
Multilingual Fluency: English, German, Hungarian, French
Dramatic & Comedic Range: Specialized in high-society characters, physical/slapstick comedy, and genre science fiction.
Formal Training: Otto Falckenberg School of the Performing Arts (Munich), complemented by intensive private dramatic coaching.
Key Achievements
Cult Sci-Fi Status: Immortalized the premier character “Maya” in Season 2 of Space: 1999, requiring extensive prosthetic makeup and creating a global fanbase.
Box Office Success: Featured as the primary female lead opposite Peter Sellers in the smash-hit comedy The Return of the Pink Panther (1975).
Literary Author: Documented her life in two critically praised autobiographies: A Constant Alien (2016) and When God Was Out For Lunch (2018).
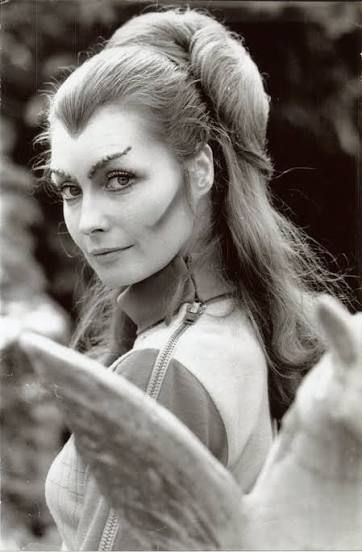
Catherine Schell as the shape-shifting alien Maya in Space: 1999
Comprehensive Chronological Timeline
1944–1957: Early Life and Displacement
1944: Born in Budapest during an allied bombing raid to Baron Paul Schell von Bauschlott (a diplomat) and Countess Katharina Maria Etelka Georgina Elisabeth Teleki de Szék.
1945–1948: Experienced post-war Russian occupation and absolute poverty after the Nazi and Communist regimes confiscated her family’s ancestral estates.
1948: Escaped Hungary with her family, living as refugees in Vienna and Salzburg, Austria.
1950: Emigrated to the United States. Her father renounced his noble title to secure American citizenship. Catherine entered a strict Catholic convent school on Staten Island, New York.
1956: Her mother became a cause célèbre and was imprisoned for actively protesting the Soviet invasion of Hungary.
1957–1967: Training and European Screen Debut
1957: Relocated to Munich, Germany, where her father joined Radio Free Europe. She attended the American School and fell in love with acting.
1961–1963: Entered Munich’s prestigious Otto Falckenberg School but pivoted to private lessons to rapidly master theatrical German.
1964: Made her professional feature film debut under the name “Catherine von Schell” in the German adventure film Lana, Queen of the Amazons, followed by the crime mystery Traitor’s Gate (Das Verrätertor).
1967: Starred in the Euro-drama film Hell Is Empty.
1968–1974: Rise in British Cinema & Franchise Success
1968: Co-starred in The Amsterdam Affair, where she met her first husband, British actor William Marlowe. She permanently relocated to London.
1969: Achieved massive international visibility through two high-profile Hammer/Eon productions:
Cast as Nancy, one of Blofeld’s “Angels of Death,” in the James Bond classic On Her Majesty’s Secret Service.
Starred as Clementine in Hammer Film’s sci-fi adventure Moon Zero Two.
1971: Guest-starred in the landmark British action-comedy series The Persuaders! (episode: “The Gold Napoleon”).
1972: Appeared alongside Bette Davis in the film Madame Sin and took a regular television role as Diane Marsh in The Adventurer.
1974: Co-starred with Michael Caine in the political thriller The Black Windmill and took the role of Jenny in the cinematic adaptation of Callan.
1975–1979: The “Golden Era” (Pink Panther & Space: 1999)
1975: Reached peak mainstream cinematic fame as Lady Claudine Litton in The Return of the Pink Panther. Her genuine struggle to suppress laughter at Peter Sellers’ improvisations was deliberately left in the final cut by director Blake Edwards.
1975: Portrayed the “Servant of the Guardian” in the Season 1 episode of Space: 1999 titled “Guardian of Piri”.
1976–1977: Hired by producer Fred Freiberger to inject new energy into Season 2 of Space: 1999. She played Maya, a brilliant, shape-shifting alien from the planet Psychon. The role required hours of daily cosmetic transformations and solidified her legacy as a sci-fi icon.
1977: Divorced William Marlowe. Met TV director Bill Hays while filming the series Looking for Clancy. She also starred in the fantasy film Gulliver’s Travels.
1979: Delivered two more definitive genre performances:
Played Countess Heidi Scarlioni opposite Tom Baker’s Fourth Doctor in the legendary Doctor Who serial “City of Death”.
Re-teamed with Peter Sellers in the comedy feature The Prisoner of Zenda.
1980–1996: Mature Dramatic Roles and Later Career
1980–1981: Appeared in episodic television such as The Gentle Touch, The Spoils of War, and The Island of Adventure.
1982: Married director Bill Hays.
1983–1985: Balanced prominent theatre and television work, including guest roles on Bergerac and a prestigious TV production of A Month in the Country (1985).
1988: Played Lotte Zons in the critically acclaimed cinematic period drama On the Black Hill.
1989: Guest-starred in highly rated British soaps and procedurals, including The Bill and Howards’ Way.
1990: Starred as Virginia Mitchell (aka Dominique) in the popular WWII French Resistance TV drama Wish Me Luck.
1991–1994: Appeared in Lovejoy (1991), Piccolo grande amore (1993), and the TV mini-series The Wimbledon Poisoner (1994).
1996: Officially stepped back from full-time acting after appearing as Inspector Helene Masson in the crime drama series The Knock.
1997–2019: Retirement and Hospitality in France
1997–2005: Relocated to the historic village of Bonneval in France. She successfully owned and operated a small, highly regarded boutique guest hotel/Chambre d’Hôtes.
2006: Suffered the tragic loss of her husband, Bill Hays, who passed away in March. Subsequently retired from running the guest house.
2016: Published her first critically well-received autobiography, A Constant Alien (Fantom Publishing).
2018: Released her second volume of memoirs, When God Was Out For Lunch.
2020–Present: Selective Return to the Screen
2020: Made a grand return to television under the direction of Damon Thomas, portraying Duchess Valeria in the critically praised BBC/Netflix horror mini-series Dracula.
2022: Cast by director Rob Zombie as Zoya Krupp in the feature film adaptation of The Munsters.
Leigh’s cotton mill heritage represents the peak and final generation of the Lancashire textile empire. Originally a dairy farming and domestic weaving town, Leigh evolved rapidly into a highly specialised fine-cotton spinning powerhouse, capitalising on local coal measures and the Bridgewater Canal.
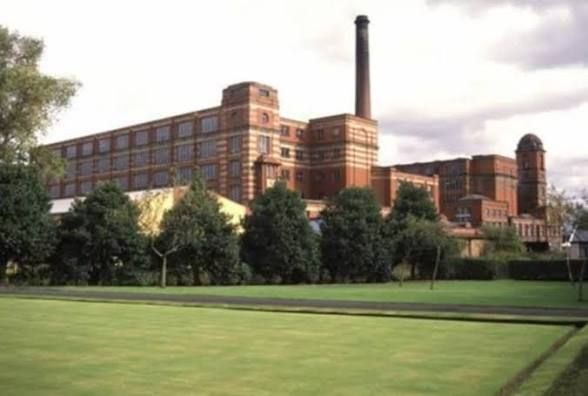
Unlike older mill towns that grew haphazardly, Leigh’s industry peaked late, culminating in massive 20th-century “double mills” like the iconic Grade II listed Leigh Spinners Mill*. Today, these red-brick giants have transitioned from empty eyesores into thriving community hubs, arts centers, and commercial business parks.
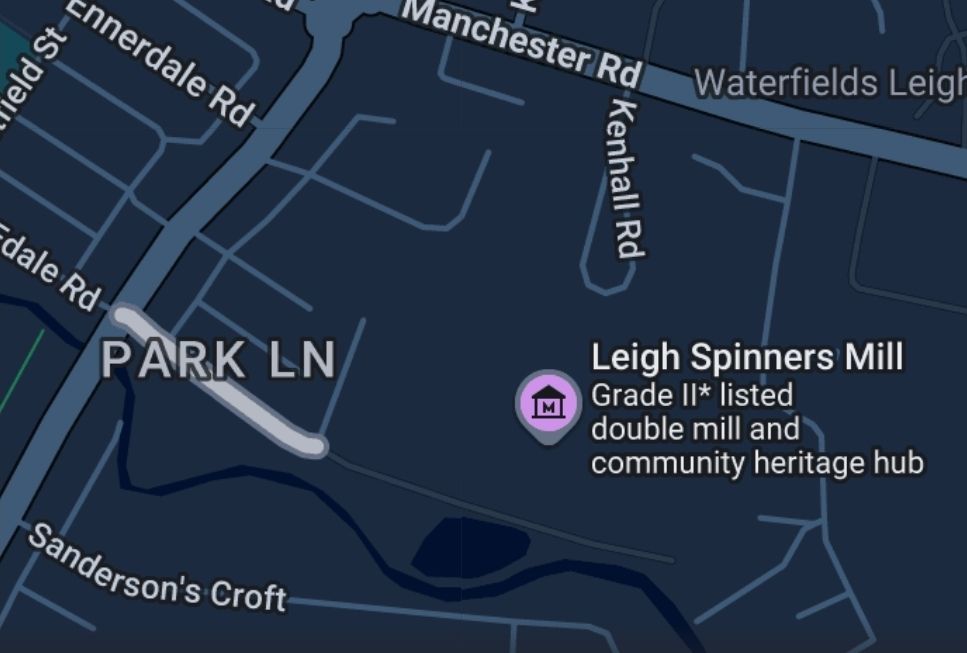
The iconic Grade II listed Leigh Spinners Mill
Detailed Timeline Breakdown by Era
1. The Pre-Industrial & Domestic Era (Pre-1830)
Before massive brick factories dominated the skyline, textile production was a distributed, domestic industry.
1740s–1770s: Local weavers produce “fustians” (coarse cotton-linen fabrics) in their own homes. The invention of the fly shuttle and Richard Arkwright’s water frame begins to shift production from homes to early water-powered mills.
1800s–1820s: The local economy relies heavily on agriculture, domestic handloom spinning, and a flourishing silk weaving trade.
2. The Early Factory & Industrialisation Era (1830–1879)
The introduction of rotative steam engines allowing mills to move away from rivers, combined with cheap local coal, sparks Leigh’s factory revolution.
1830s: The first dedicated steam-powered cotton mills are constructed in Leigh.
1839: The “Leigh Fight” (14 August). Amid massive unemployment and Chartism protests, a mob of 2,000 workers threatens to burn down Hayes Mill. The Riot Act is read, leading to violent clashes with troops.
1858: Construction begins on the multi-storey mill on Kirkhall Lane (later known as Pennington Spinning Company).
1861–1865: The Lancashire Cotton Famine. The American Civil War blockades southern US ports. Raw cotton supplies dry up, causing widespread starvation and temporary mill closures across Leigh.
1862: F.W. Bouth founds Bouth’s Mill. []
1870s: The local silk industry collapses due to foreign competition; multi-storey silk factories like Rose Mill and Welch Mill are rapidly converted to cotton weaving.
1875: The local townships of Pennington, Westleigh, and Bedford officially merge to form the Leigh Local Board District.
3. The Boom & “Super-Mill” Era (1880–1925)
Leigh enters its golden economic age, specialising in fine-mule cotton spinning and building architectural “super-mills”.
1880s: Major industrial development concentrates along the banks of the Bridgewater Canal, including the construction of the landmark Mather Lane Mill.
1899: Leigh is officially incorporated as a Municipal Borough, reflecting its vast commercial wealth.
1905: The Butts Spinning Company constructs Butts Mill.
1911: The industry reaches its employment peak. Over 6,000 people are directly employed in Leigh’s textile sector.
1913: Entrepreneurs John Horrocks and Edward Crowther found Leigh Spinners Mill. Designed by architects Bradshaw, Gass & Hope, “Mill 1” (East Section) opens alongside its boiler house and landmark chimney stack.
1914–1918: Outbreak of World War I halts the export markets and severely disrupts further building expansions.
1923–1925: Construction resumes post-war. “Mill 2” (West Section) is completed, making Leigh Spinners one of the most complete double mill complexes in the United Kingdom.
4. The Slump, War, & Industrial Decline (1926–1999)
Global competition, lack of technical modernization, and shifting markets trigger a long, irreversible contraction.
1920s–1930s: The Great Depression triggers massive closures. Despite slumps, cotton still provides about 14% of all local employment (approx. 6,000 jobs). Pennington Mill shuts its doors in 1930.
1939–1945: World War II temporarily shifts mill focus to industrial war fabrics, and some empty sheds are utilised as prisoner-of-war camps.
1950s–1960s: Post-war decline accelerates. Butts Mill ceases spinning operations entirely in 1960. Across Lancashire, mills close at a catastrophic rate of one per week.
1969: Facing the total collapse of the cotton thread trade, Leigh Spinners Ltd structurally shifts its business model from cotton yarn spinning to carpet manufacturing.
5. Dereliction & Modern Regeneration (2000–Present)
The 21st century sees a major pivot toward preserving architectural heritage via community asset conversion.
2012: Leigh Spinners expands its manufacturing footprint to produce modern synthetic turf products for sports and landscaping.
2013: The Leigh Building Preservation Trust (LBPT) is formed to save the decaying sections of the mill and its rare Yates & Thom cross-compound steam engine. They secure a vital £75,000 restoration grant.
2018: Volunteers successfully turn the historic mill steam engine for the first time in decades. Roof repairs begin on Mill 2.
2020s: Rapid floor-by-floor expansion transforms the site into a massive dynamic space.
Present Day: Leigh Spinners Mill functions as a premier heritage centre. It hosts more than 60 local tenants, featuring sports gyms, art studios, an independent cinema, a computer museum, and community facilities.
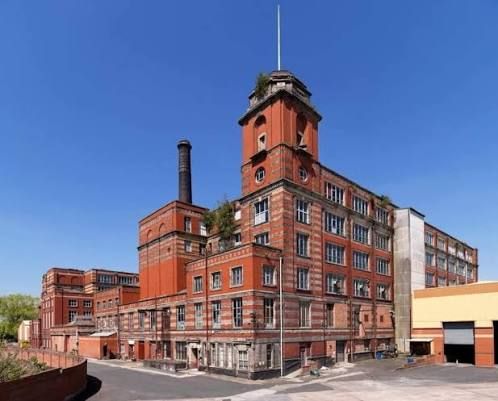
Leigh Spinners Mill functions as a premier heritage centre
Leigh Spinners Mill is a premier heritage and community hub that has transformed a historic industrial space into a thriving cultural asset. Located in Leigh, Greater Manchester, this Grade II* listed former cotton mill stands as one of the finest and most intact double-mill complexes in the UK.
Today, managed by the Leigh Building Preservation Trust (LBPT), it functions as a vibrant mix of historical preservation, business enterprise, and creative arts.
The Heritage Experience
The Heritage Centre: Located on the first floor, it showcases a vast collection of local history displays, photographs, oral histories, and industrial artefacts discovered during the mill’s renovation.
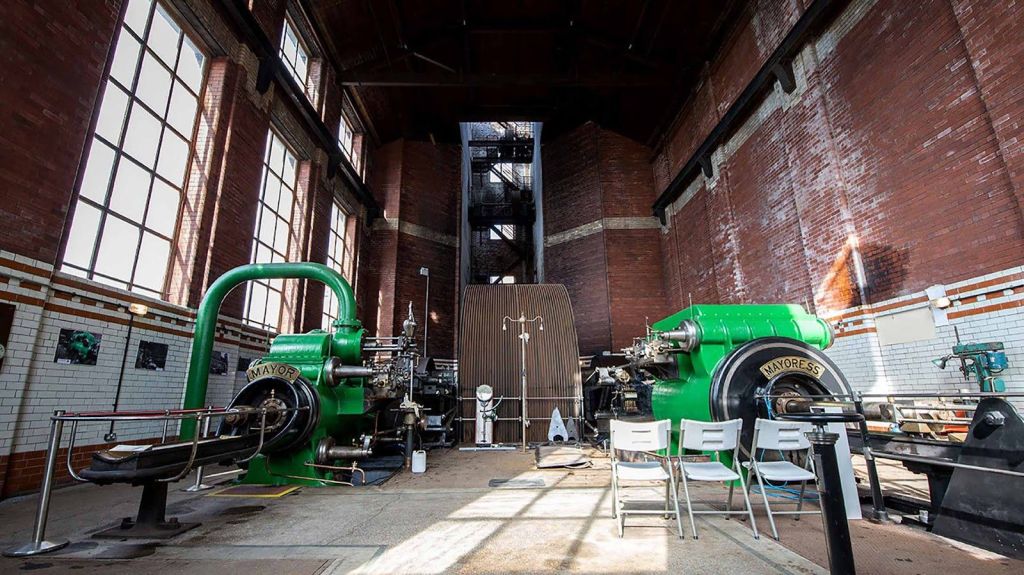
The Steam Engine House: Home to the “Mayor and Mayoress,” a massive 1,800-horsepower twin horizontal cross-compound steam engine built in 1923 by Yates & Thom. It is the largest surviving mill engine of its type in the UK.
Steam Engine House: the “Mayor and Mayoress,” a massive 1,800-horsepower steam engine
Architectural Tours: Enthusiastic volunteer guides lead public tours detailing the mill’s 20th-century Italianate and neo-Baroque architecture designed by Bradshaw Gass & Hope.
A Thriving Multi-Floor Community Hub
Beyond its industrial history, the mill has been partitioned into creative and commercial spaces housing over 80 independent businesses, charities, and sports facilities across its upper floors:
Northwest Computer Museum: A massive retro-tech attraction showcasing fully working generation-one computers and classic video game consoles like the Commodore 64 and Sinclair Spectrum amongst many others.
Sports & Leisure Floor: Features diverse athletic groups including martial arts dojos, an archery centre, a boxing club, table tennis, and yoga studios.
Retail & Amenities: Visitors can browse local maker spaces and craft workshops or relax at the mill’s local café.
Visitor Information
Address: Park Lane, Leigh, Greater Manchester, WN7 2LB.
Cost: Entry to the Heritage Centre and engine room displays is completely free of charge (donations to the trust are welcome).
Heritage Centre Opening Hours: Generally open to the public on Thursdays and Saturdays from 10:00 AM to 2:00 PM. Individual tenant hours across the rest of the mill vary daily.
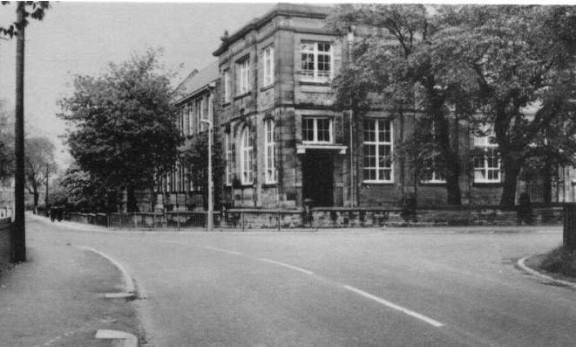
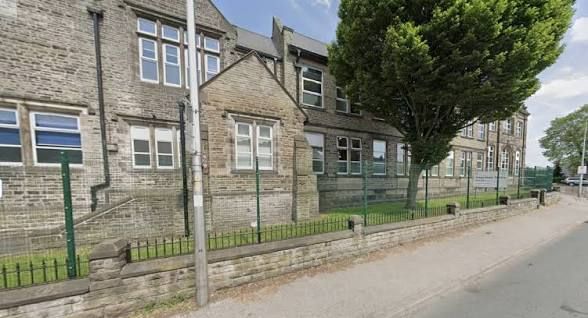
Hindley Park High School (originally founded as Hindley and Abram Grammar School) was a historic secondary school located on Park Road in Hindley, Wigan, Greater Manchester. I attended the school from 1980 thru 1985.
Operating under its final name until its closure in August 1991, the institution served the local community for over three centuries. The iconic Victorian school building still stands today and serves the region as the Three Towers Academy.
Park High Secondary School, Hindley, Wigan – Overview and Timeline
Full Institutional Description
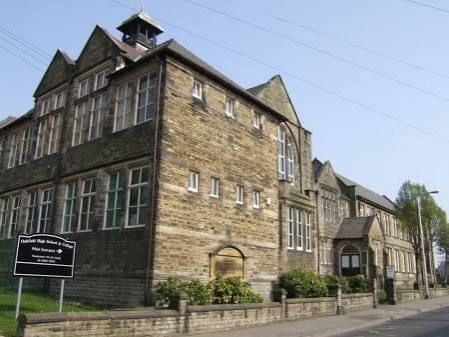
Location and Campus: Located on Park Road, Hindley, the school campus features a prominent mid-Victorian main building constructed of traditional red brick and stone dressings. The site evolved from a single large schoolroom to include a master’s house, separate classrooms, and the landmark Carlton Villas (acquired in 1937 as headmaster quarters).
Academic Identity: For most of its existence, it operated as a selective Grammar School focusing on classical education, mathematics, and sciences. In its later eras, it transitioned into a non-selective voluntary controlled secondary school managed by the Wigan Metropolitan Borough Council.
Heritage Values: The school holds deep historical significance for the Wigan borough. Its grounds feature two prominent war memorials dedicated to the alumni who perished during World War I and World War II.
Park High Secondary School, Hindley, Wigan – side view of main building
Chronological Timeline Breakdown
Era 1: The Foundations & Lowe Hall (1632 – 1855)
1632:The Hindley and Abram Grammar School is officially established through a charitable foundation. It opens inside “Lowe Hall” off Stony Lane (modern-day Liverpool Road) and is locally dubbed The Lowe School.
1829: The school updates its charter; while originally free, the Headmaster is granted the liberty to charge tuition fees for advanced instruction in Latin, arithmetic, and writing.
1848: The campus layout at Lowe Hall is formally documented for the first time on the inaugural Ordnance Survey map.
Era 2: The Park Road Relocation & Growth (1856 – 1979)
1856: The school outgrows its original home and relocates to a brand-new building on Park Road, anchoring its identity to the “Park” area of Hindley.
1882: The infrastructure expands significantly to accommodate a growing pupil registry. The site now comprises a large central schoolroom, a secondary classroom, and a dedicated headmaster’s residence.
1900s–1930s: The school undergoes rapid student growth. In 1937, the neighbouring Carlton Villas are formally purchased to serve as upgraded residential quarters for the headmaster.
1944–1970s: Following the Education Act of 1944, the school solidifies its role as a key selective grammar school for the Hindley and Abram districts, operating alongside local secondary modern alternatives.
Era 3: The 1980s Transformation (1980 – 1989)
1980–1985: Amidst a nationwide shift away from selective education, the school operates as Hindley Park High School, a voluntary controlled secondary school. It adapts its classical grammar curriculum to broader secondary education requirements.
1986–1888: Financial strain and shifting local demographics within the Wigan Council area prompt institutional reviews regarding school surplus spaces across the borough.
1989: Local education authorities begin formal consultations regarding the consolidation of secondary education in Hindley, outlining plans to phase out the historic Park Road site in favour of expanding Outwood Academy Hindley (then known as Mornington High School).
Era 4: Closure & Modern Reuse (1990 – Present)
1991: On 31 August 1991, Hindley Park High School officially closes its doors to pupils, ending 359 years of direct educational lineage.
1992–2010s: The building is preserved by the local authority and repurposed as a Teachers’ Development Centre.
2020s: The historical complex finds a permanent modern educational use. The facility is occupied by the Three Towers Alternative Provision Academy, ensuring the 1856 building continues to serve local children needing specialised support.
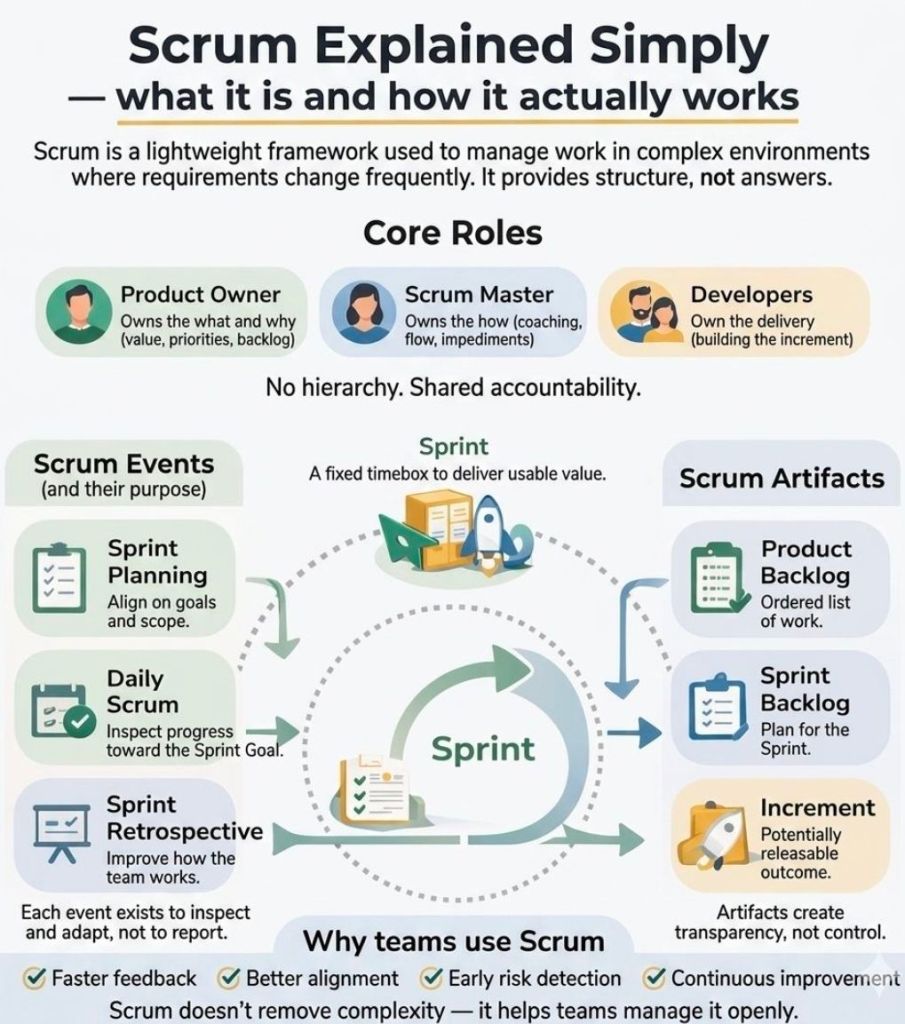
Agile is a project management philosophy, while Scrum is the structured, real-world framework used to put that philosophy into action. Think of Agile as a commitment to healthy living, and Scrum as the specific daily workout routine you follow to stay fit. Instead of planning a massive project from start to finish upfront, Scrum breaks the work down into small, manageable pieces delivered in short cycles.
The easiest way to understand Scrum is through the 3-5-3 Rule: 3 Roles, 5 Events, and 3 Artifacts.
👥 The 3 Roles
A standard Scrum team is small, cross-functional, and self-managing, meaning they have all the skills needed to complete the work without relying on outsiders.
Product Owner: The visionary. They understand customer needs, decide what needs to be built, and maintain the master to-do list.
Scrum Master: The coach. They do not manage the team; instead, they protect them from distractions, facilitate meetings, and clear roadblocks.
Developers: The builders. This includes the engineers, designers, or writers who do the hands-on work and decide how to build it.
📦 The 3 Artifacts
Artifacts are simply the tangible items or lists used to maintain transparency across the project.
Product Backlog: The ultimate master list of features, fixes, and requirements needed for the product, prioritized by value.
Sprint Backlog: The specific subset of items selected from the master list that the team commits to finishing during the current cycle.
Increment: The final, working piece of the product delivered at the end of a cycle that meets the team’s “Definition of Done”.
📅 The 5 Events (Ceremonies)
Scrum operates in time-boxed blocks called Sprints, which usually last 1 to 4 weeks. Each Sprint includes four distinct meetings:
The Sprint: The time-box itself where the actual building happens.
Sprint Planning: A meeting at the start of a Sprint where the team decides what they can realistically achieve and creates a plan.
Daily Scrum (Stand-up): A quick, 15-minute daily meeting where developers sync on progress, plan the next 24 hours, and flag blockers.
Sprint Review: A showcase held at the end of the Sprint to demo the working increment to stakeholders and gather feedback.
Sprint Retrospective: An internal team meeting to review what went well, what went wrong, and how to improve the process for the next Sprint.
🏗️ Why Does Scrum Work?
Scrum relies entirely on Empiricism, meaning making decisions based on real-world evidence rather than guesswork. It stands firmly on three pillars:
Transparency: Everyone involved sees exactly what is happening.
Inspection: The team frequently stops to check the quality of the product and progress.
Adaptation: If something goes off-course, the team shifts direction immediately rather than blindly following an outdated plan.