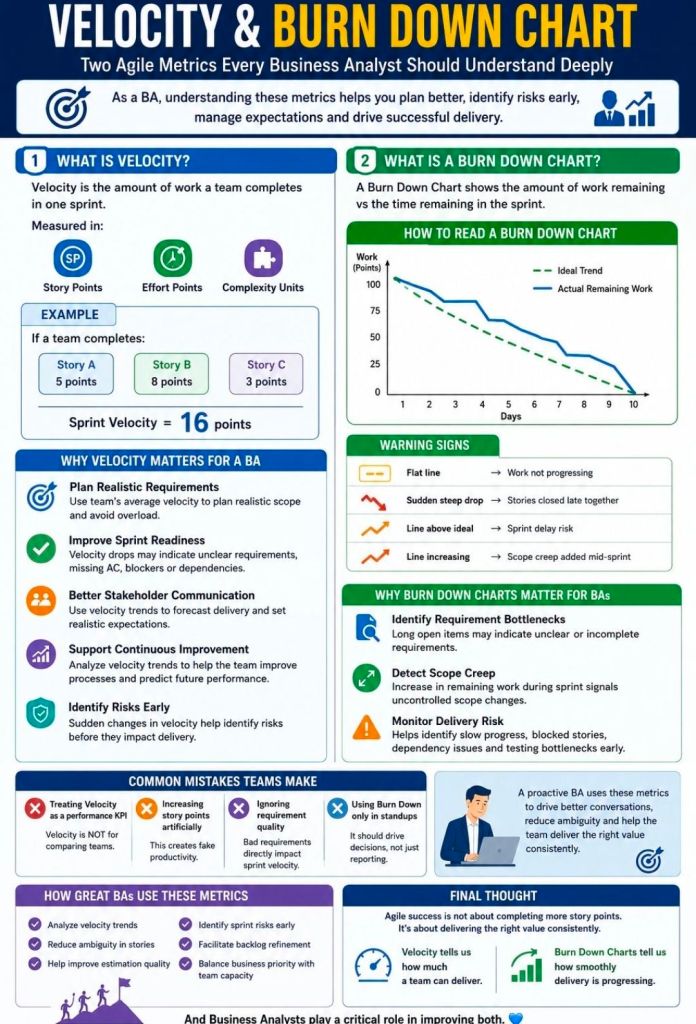
Scrum velocity and burndown charts are essential agile metrics used to measure team capacity and track progress. Velocity measures the average story points completed over past sprints to forecast future capacity. Burndown charts visually represent the remaining work daily, highlighting if the team is on track to meet sprint goals.
Scrum Velocity
Definition: The amount of work (usually in story points or hours) a team completes in a single sprint.
Purpose: Helps forecast team capacity for future sprints and promotes sustainable pace.
Calculation: Sum of story points for all “Done” items at the end of a sprint.
Best Practice: Average velocity over 3–5 sprints provides a more accurate, stable forecast.
Burndown Chart
Definition: A graph showing the amount of work remaining versus time (days) in a sprint.
Components:
Ideal Work Line: A straight line showing the projected pace to complete work.
Actual Work Line: A line plotting daily completed work against the ideal line.
Purpose: Provides daily visibility into progress and detects risks early (e.g., if the line is above the ideal, the team is behind).
Types: Sprint Burndown (short term) vs. Release/Product Burndown (long term).
Key Differences
Velocity is a planning metric looking at historical performance.
Burndown is a monitoring tool looking at current progress.
Common Pitfalls
Velocity: Treating velocity as a productivity metric (it is a capacity planning metric) or comparing it between teams.
Burndown: Using “manual updates” rather than automated tools, leading to inaccurate data.
Both: Neglecting to refine user stories, which makes velocity unpredictable and burndowns inaccurate.
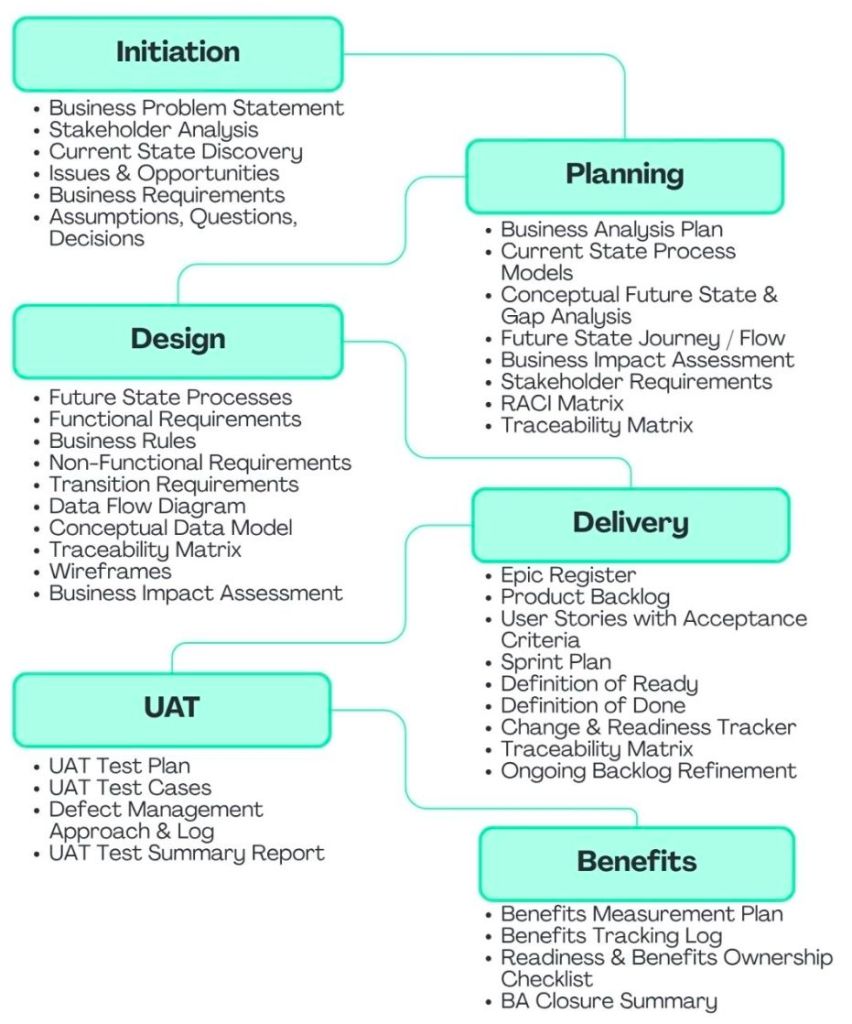
Business analyst deliverables are essential documentation and artifacts produced throughout a project to define business needs, bridge gaps between stakeholders and technical teams, and ensure solutions deliver value. Key deliverables include the Business Case, Stakeholder List, Requirement Packages (BRD/User Stories), Process Models, and Transition Requirements.
Core Business Analyst Deliverables by Phase:
Initiation/Discovery:
Business Case: Outlines the justification for the project, including cost-benefit analysis and ROI.
Problem Statement/Project Scope: Defines the “why” and boundaries of the project.
Stakeholder Map/Matrix: Identifies key stakeholders and their influence.
Planning:
Business Analysis Plan: Outlines the approach, tasks, and techniques to be used.
Communication Plan: Defines how stakeholders will receive updates.
Elicitation & Analysis:
Current State Assessment (As-Is): Documents how processes work today.
Future State Modeling (To-Be): Visualizes the desired future processes.
Gap Analysis: Details what needs to change to get from current to future state.
Business Requirements Document (BRD): A formal document detailing what the business needs to achieve.
Solution Definition (Design & Implementation):
Functional/Non-Functional Requirements (SRS): Technical details on how the system should act.
Use Cases/User Stories: Detailed scenarios of user interactions with the system.
Prototypes/Wireframes: Visual representations of user interfaces.
Product Backlog (Agile): A prioritized list of user stories.
Evaluation & Closure:
Acceptance Criteria & Test Cases: Defines the criteria for a completed feature.
Solution Assessment/Validation Report: Evaluates if the delivered solution met the needs.
Lessons Learned/Closing Report: Documents successes and improvements for future projects.
Key Takeaways:
Formal vs. Informal: Plan-driven (Waterfall) projects use heavy formal documentation (BRD, SRS), while change-driven (Agile) projects focus on lighter tools like user stories, Jira tickets, and prototypes.
Value-Driven: Deliverables exist to facilitate communication, align stakeholders, and ensure project success.
Note: The specific deliverables required are usually determined in the initial project planning stage.