Project Management Office (PMO) models dictate the structure, control level, and strategic focus of a PMO within an organization. The most common frameworks break down into three primary operational types, alongside broader structural and strategic classifications that define how governance is applied.
Project Management Office (PMO) models overview
1. Operational Models (By Control Level)
These models define how the PMO interacts with project teams and enforces standards.
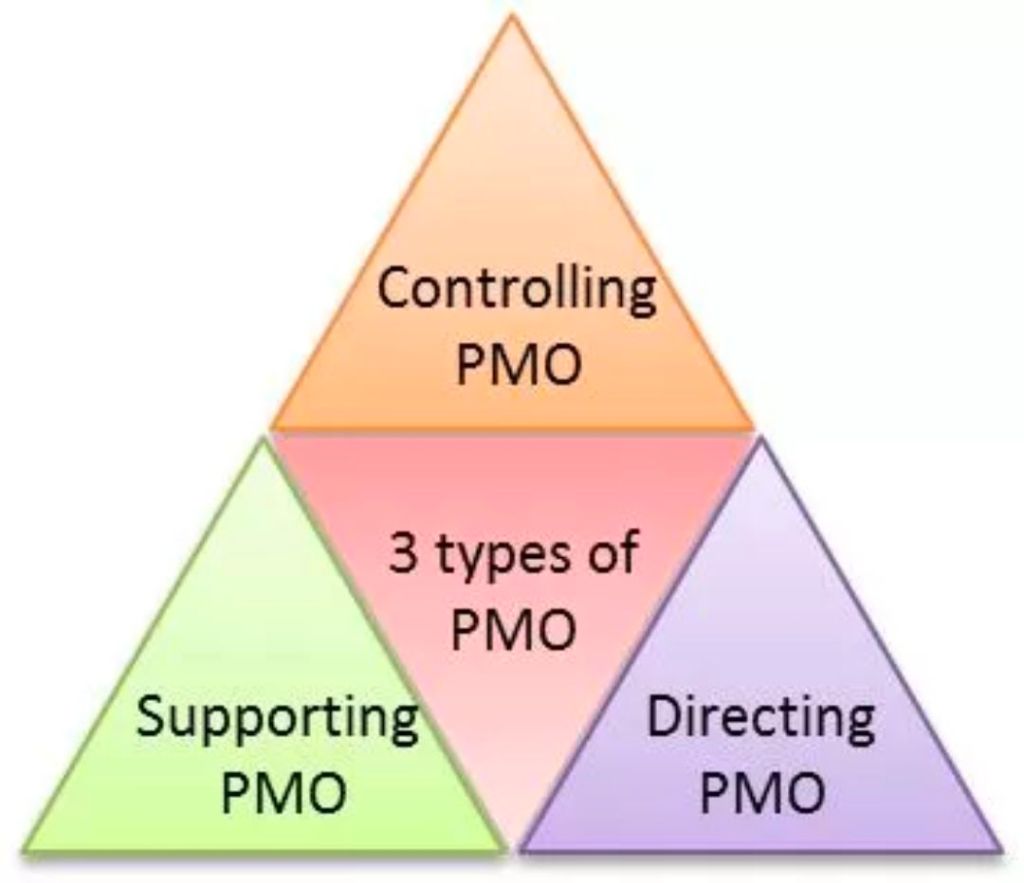
Supportive PMO: Acts as an advisory entity. It provides templates, best practices, training, and tools on demand, but has no direct control or authority over project execution. Best for: Organizations with a decentralized, highly autonomous culture.
Controlling PMO: Enforces strict governance, standardizes methodologies, and ensures compliance across all initiatives. It provides more than advice and actively verifies adherence, but typically relies on established escalation paths rather than direct authority. Best for: Organizations that need consistency and reduced risk.
Directive PMO: Assumes full control and direct ownership of projects. The PMO assigns project managers, directs resources, and takes total responsibility for execution, timelines, and outcomes. Best for: Complex or mission-critical projects requiring rigid governance.
2. Structural Models (By Scope & Placement)
These classifications indicate where the PMO sits and its organizational reach.
Enterprise PMO (EPMO): Operates at the highest organizational level, overseeing the entire project portfolio. It ensures all programs directly align with overarching corporate business objectives and strategy.
Departmental/Divisional PMO: Supports specific business units (such as IT, Marketing, or Engineering). It is highly tailored to the specialized needs of that function, though it runs the risk of creating siloed practices.
Embedded or Project-Specific PMO: A temporary model dedicated to one large, highly complex, or mission-critical project or program. It lasts for the duration of the project and then disbands or reallocates.
3. Advanced / Strategic Models (By Focus)
Modern organizations often adapt the PMO to focus on high-level value rather than just tracking timelines.
Center of Excellence (CoE): Focuses heavily on continuously elevating the organization’s project management maturity. It acts as an innovation hub for methodologies, technology evaluation, and skill-building.
Value Management Office (VMO): Focuses entirely on benefits realization and return on investment (ROI). Rather than just asking “are we on time?”, it asks “is this project generating the business value we wanted?”
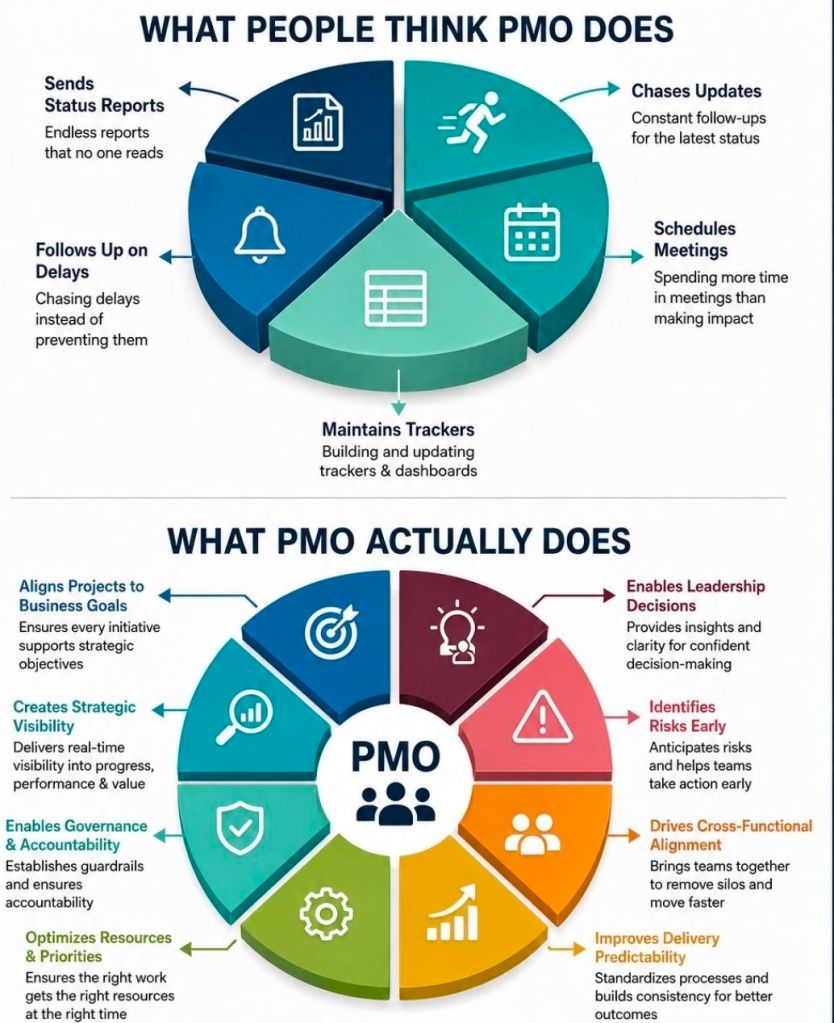
A Project Management Office (PMO) is a centralized department within an organization tasked with standardizing project management processes, enforcing governance, and aligning projects with strategic business goals. Its primary mission is to optimize resource utilization, mitigate risks across the portfolio, and improve the overall success rate of projects.
The core responsibilities of a PMO vary based on its organizational maturity and type (Supportive, Controlling, or Directive), but generally span five major domains:
1. Governance and Standardisation
Developing Methodologies: Establishing uniform frameworks, processes, and project management methodologies (such as Agile, Waterfall, or hybrid models) across all departments.
Creating Templates: Developing standard documentation, templates, and tools to ensure consistency in project initiation, tracking, and reporting.
Conducting Audits: Monitoring compliance with established standards through health checks and project reviews to identify and correct process deviations.
2. Strategic Portfolio Management
Strategic Alignment: Ensuring every project investment directly supports the organization’s high-level strategy and long-term business goals.
Project Prioritization: Evaluating incoming project proposals and business cases to prioritize high-value initiatives while deferring or canceling low-priority options.
Benefits Realization: Tracking and measuring project outcomes to ensure that completed deliverables provide the expected economic or structural value to the company.
3. Monitoring, Tracking, and Reporting
Performance Reporting: Collecting and analyzing performance metrics via dashboards to provide regular progress updates to senior executives and stakeholders.
Dependency Management: Tracking cross-project dependencies, scheduling overlaps, and potential bottlenecks to prevent organizational conflicts.
Risk Management: Identifying systemic risks and early-warning signs of failing projects to trigger timely interventions or escalation protocols.
4. Resource and Capacity Management
Resource Optimization: Coordinating the allocation and utilization of personnel, skill sets, and budgets across the entire project portfolio.
Capacity Planning: Assisting line managers with strategic capacity planning to identify talent gaps, prevent team burnout, and support hiring decisions.
Effort Estimation Support: Providing historical data and expert insights to help project teams produce accurate cost and time estimates.
5. Training and Knowledge Management
Mentorship and Coaching: Providing regular guidance, professional coaching, and continuous support to project managers and their delivery teams.
Skills Development: Organizing training sessions and educational paths on core project management practices, specialized software, and new industry standards.
Lessons Learned Repository: Maintaining a centralized repository of project documentation, historical metrics, and post-project reviews to drive continuous organizational learning.
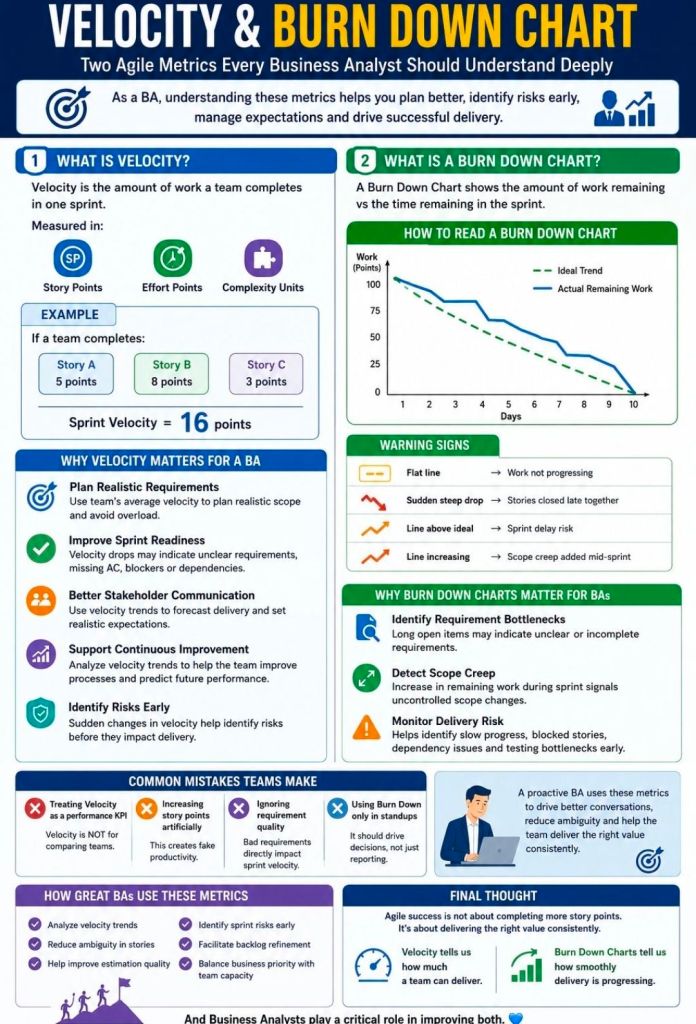
Scrum velocity and burndown charts are essential agile metrics used to measure team capacity and track progress. Velocity measures the average story points completed over past sprints to forecast future capacity. Burndown charts visually represent the remaining work daily, highlighting if the team is on track to meet sprint goals.
Scrum Velocity
Definition: The amount of work (usually in story points or hours) a team completes in a single sprint.
Purpose: Helps forecast team capacity for future sprints and promotes sustainable pace.
Calculation: Sum of story points for all “Done” items at the end of a sprint.
Best Practice: Average velocity over 3–5 sprints provides a more accurate, stable forecast.
Burndown Chart
Definition: A graph showing the amount of work remaining versus time (days) in a sprint.
Components:
Ideal Work Line: A straight line showing the projected pace to complete work.
Actual Work Line: A line plotting daily completed work against the ideal line.
Purpose: Provides daily visibility into progress and detects risks early (e.g., if the line is above the ideal, the team is behind).
Types: Sprint Burndown (short term) vs. Release/Product Burndown (long term).
Key Differences
Velocity is a planning metric looking at historical performance.
Burndown is a monitoring tool looking at current progress.
Common Pitfalls
Velocity: Treating velocity as a productivity metric (it is a capacity planning metric) or comparing it between teams.
Burndown: Using “manual updates” rather than automated tools, leading to inaccurate data.
Both: Neglecting to refine user stories, which makes velocity unpredictable and burndowns inaccurate.
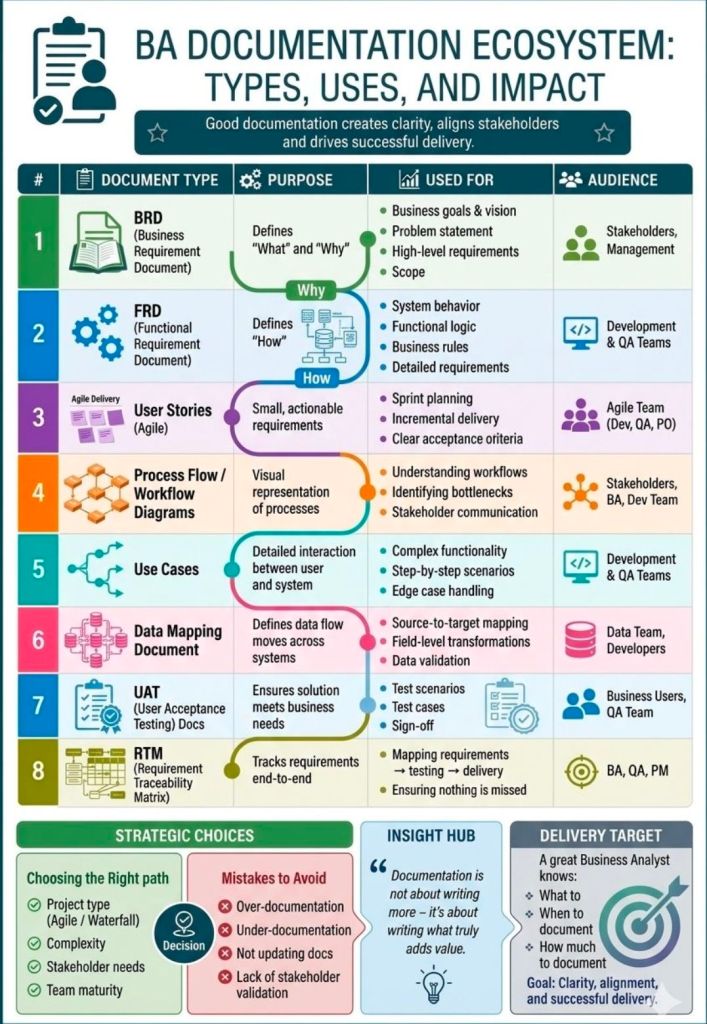
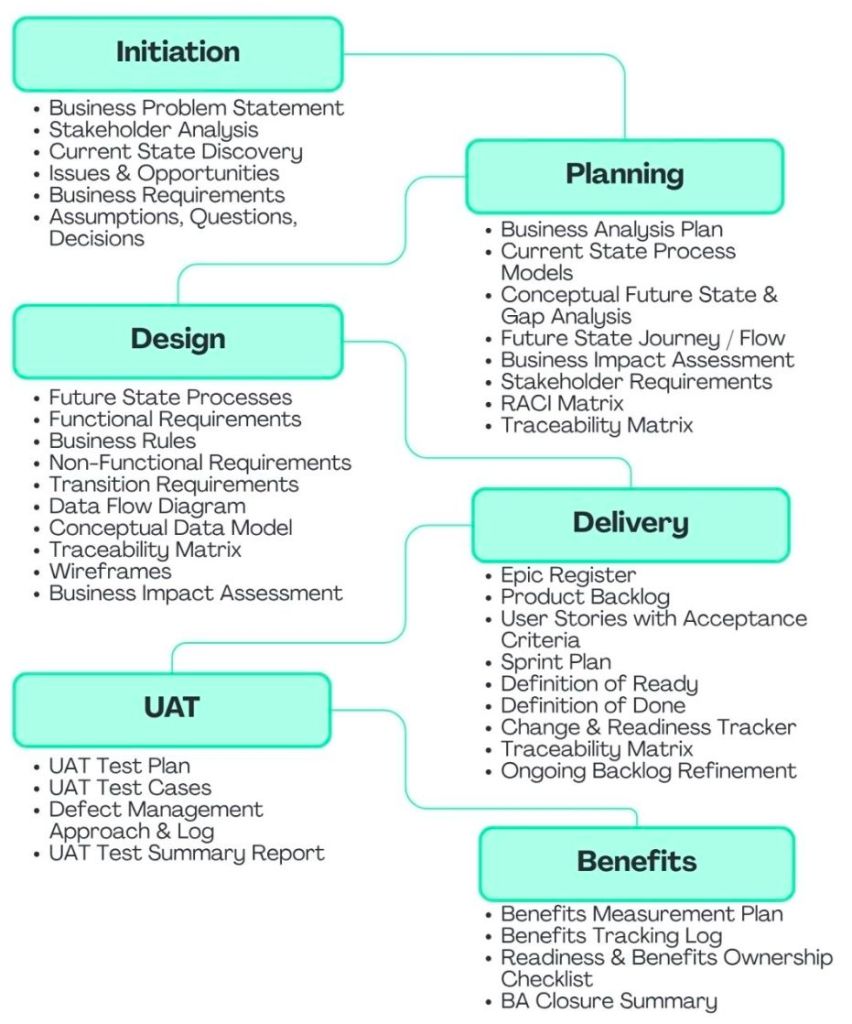
Business analyst deliverables are essential documentation and artifacts produced throughout a project to define business needs, bridge gaps between stakeholders and technical teams, and ensure solutions deliver value. Key deliverables include the Business Case, Stakeholder List, Requirement Packages (BRD/User Stories), Process Models, and Transition Requirements.
Core Business Analyst Deliverables by Phase:
Initiation/Discovery:
Business Case: Outlines the justification for the project, including cost-benefit analysis and ROI.
Problem Statement/Project Scope: Defines the “why” and boundaries of the project.
Stakeholder Map/Matrix: Identifies key stakeholders and their influence.
Planning:
Business Analysis Plan: Outlines the approach, tasks, and techniques to be used.
Communication Plan: Defines how stakeholders will receive updates.
Elicitation & Analysis:
Current State Assessment (As-Is): Documents how processes work today.
Future State Modeling (To-Be): Visualizes the desired future processes.
Gap Analysis: Details what needs to change to get from current to future state.
Business Requirements Document (BRD): A formal document detailing what the business needs to achieve.
Solution Definition (Design & Implementation):
Functional/Non-Functional Requirements (SRS): Technical details on how the system should act.
Use Cases/User Stories: Detailed scenarios of user interactions with the system.
Prototypes/Wireframes: Visual representations of user interfaces.
Product Backlog (Agile): A prioritized list of user stories.
Evaluation & Closure:
Acceptance Criteria & Test Cases: Defines the criteria for a completed feature.
Solution Assessment/Validation Report: Evaluates if the delivered solution met the needs.
Lessons Learned/Closing Report: Documents successes and improvements for future projects.
Key Takeaways:
Formal vs. Informal: Plan-driven (Waterfall) projects use heavy formal documentation (BRD, SRS), while change-driven (Agile) projects focus on lighter tools like user stories, Jira tickets, and prototypes.
Value-Driven: Deliverables exist to facilitate communication, align stakeholders, and ensure project success.
Note: The specific deliverables required are usually determined in the initial project planning stage.
Mark Whitfield, a Manchester-based Senior IT Project Manager, has completed extensive professional training throughout his career, focusing on project management methodologies, delivery software, and technical tools.
Core Project Management Methodologies :
PRINCE2 Practitioner: Certified as a registered PRINCE2 Practitioner in May 2011 via the ILX Group (Gold e-Learning).
Agile SCRUM Training: Attended in-house training with RADTAC in May 2011.
Advanced Engagement Management (Level 2): Completed at Capgemini in November 2017.
Project Management Fundamentals: Completed “Fundamentals of Successful Project Management” in February 2000 through Skillpath in Manchester.
Managing Multiple Projects: Attended “Managing Multiple Projects, Objectives and Deadlines” in October 1999/1998 via Skillpath.
Software & Cloud Platforms :
AZ-900 Microsoft Azure Fundamentals: Certified in February 2022.
Microsoft Project: Completed the Microsoft Project ’98 Certification Series in May 2000 through the IIL UK Education Centre in Reading.
Microsoft Excel Expert Skills: Upgraded skills via a 2017 Expert course and a July 2024 Udemy refresher.
Technical & Programming Courses :
Tandem / HP NonStop: Completed Tandem Guardian Principles (1993), Tandem Performance Analysis (1995), and Tandem TAL Programming (1995).
C / C++ Programming: Attended “C++ for Non-C Programmers” with Comtec Computer Training in March 1997.
Database Querying: Completed “Querying Microsoft SQL 2000 with Transact SQL” via QA Training in March 2009.
Web Applications: Attended “Developing MS ASP Web Applications using MS Visual Studio .NET” in January 2007.
Marketing & Communication Training :
Writing for the Web: Completed in May 2009 with gbdirect (iTrain Education in London).
Brochure & Document Design: Attended a SkillPath Seminar on designing marketing brochures and reports in April 2006.
A RAID log is a central project management tool used to track Risks, Assumptions, Issues, and Dependencies to ensure project success and stakeholder alignment. It is essential for complex projects, updated regularly to manage, monitor, and mitigate factors that could affect deliverables, typically maintained as a living spreadsheet or document.
Key Components of a RAID Log
Risks: Potential future problems identified and mitigated before they occur (e.g., “supplier may delay shipment”).
Actions: Specific tasks, action items, or decisions that need to be addressed, often used in agile projects.
Issues: Known, current problems that have already occurred and require immediate resolution.
Dependencies: Internal or external relationships that, if not managed, can cause delays, such as waiting on another team.
Benefits of Using a RAID Log
Proactive Planning: Allows teams to identify and prepare for potential issues early.
Centralized Information: Provides a single, updated document for tracking, improving communication with stakeholders.
Improved Decision-Making: Helps in making informed decisions by logging the impact of changes.
Audit Trail: Acts as a record for project meetings, reviews, and post-mortem analysis.
How to Implement a RAID Log
Start Early: Create the log during the project planning or initiation phase.
Update Frequently: Review and update the log consistently, at least after every team meeting or weekly.
Assign Owners: Ensure every risk and issue has a specific person responsible for it.
Use a Template: Use an Excel or project management software tool, tracking columns like description, owner, impact, and status.
While some teams use it primarily for risks and issues, the “A” and “D” can stand for Actions and Decisions, respectively, depending on the team’s needs.