Cost Estimating vs Cost Planning

Cost Estimating vs Cost Planning

In professional project management and construction, cost estimating and cost planning are complementary processes that occur at different stages to ensure a project remains financially viable

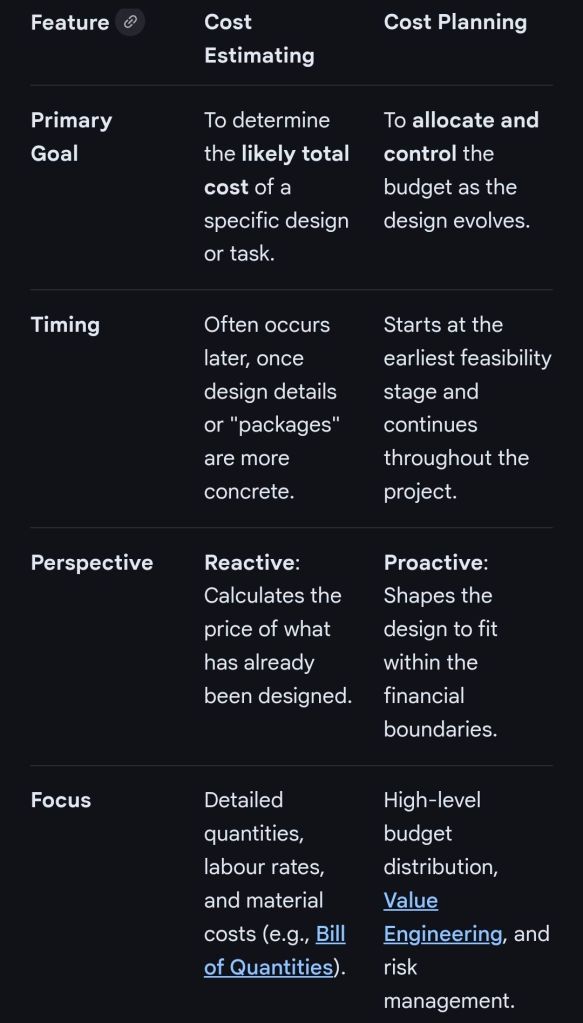
1. Cost Estimating: “What will it cost?”

Cost estimating is a technical assessment used to predict the expenditures for a project. 

  • Early Stages: Estimates might be “rough orders of magnitude” based on square footage or historical data (e.g., cost per hotel room).
  • Later Stages: Estimates become precise “tender figures” used by contractors to bid on work, factoring in current market rates for labour and materials.
  • Function: It answers the question: “Is this specific plan affordable?”. 

2. Cost Planning: “How do we stay on budget?”

Cost planning is a strategic framework that manages a project’s financial health from start to finish. 

  • Iterative Process: It is a “living document” that is updated as the project moves from concept to detailed design.
  • Allocation: It breaks down the total budget into “elemental” targets (e.g., spending £X on the foundation and £Y on finishes).
  • Control: If an estimate for one part of the project exceeds its target, the cost plan guides the team to adjust the design or find savings elsewhere to keep the overall project on track. 

Standard Professional Guidance

The Royal Institution of Chartered Surveyors (RICS) provides the New Rules of Measurement (NRM 1), which standardises how these processes work together: 

  1. Order of Cost Estimate: Establishing the initial viability of a project.
  2. Elemental Cost Plan: Breaking the estimate down into functional parts.
  3. Cost Checking: Continually comparing design changes against the cost plan to prevent overspending.
Cost Estimating vs Cost Planning

Benefits Realization Process is a structured framework

Benefits Realization Process

The benefits realization process is a structured framework used to ensure that projects and programmes deliver the tangible value and strategic outcomes intended by an organisation. Unlike traditional project management, which focuses on outputs (deliverables like a new software), benefits realization focuses on outcomes (the actual value derived, such as a 10% increase in efficiency). 

Core Stages of the Process

While various frameworks exist, most follow three or four primary stages:

  • 1. Identification: Defining the expected benefits at the start of a project. This involves aligning benefits with the organisation’s strategic goals and identifying “benefit owners” who will be accountable for their delivery.
  • 2. Planning: Developing a Benefits Realization Plan that establishes metrics, Key Performance Indicators (KPIs), and timelines for when benefits will be achieved.
  • 3. Execution & Delivery: Monitoring and managing the project to ensure it stays on track to deliver the planned benefits. This includes managing risks that could negatively impact benefit delivery.
  • 4. Sustainment & Review: Occurring post-project completion, this stage focuses on ensuring benefits are fully realized and sustained over the long term. A final review is conducted to compare actual results against the original business case

Key Components and Tools

  • Benefits Register: A central document used to track and manage all identified benefits, their owners, and their current status.
  • Benefit Profiles: Detailed records for individual benefits, describing what they are, how they will be measured, and who is responsible for them.
  • Benefit Dependency Map (BDM): A visual tool showing the links between project outputs, organizational changes, and final strategic objectives.
  • Benefit Owners: Individuals (usually from the business side) who are accountable for ensuring a specific benefit is achieved and sustained after the project team disbands. 

Why It Matters

Organizations that mature in benefits realization management are significantly more likely to meet their original goals and business intent. It bridges the gap between high-level strategy and tactical project execution, ensuring that investments translate into actual business value

Benefits Realization Process is a structured framework

Project Quality Plan PQP in QA/QC Overview

Project Quality Plan PQP in QA/QC Overview

The primary purpose of a Project Quality Plan (PQP) is to define the standards, tools, and processes required to ensure a project’s deliverables are “fit for purpose” and meet all stakeholder expectations. It serves as a strategic roadmap for the project team to maintain consistent quality throughout the project lifecycle rather than treating it as an afterthought. 

Core Objectives

A PQP is designed to achieve several critical goals: 

  • Define “Quality”: Translates vague stakeholder needs into measurable criteria and specific benchmarks.
  • Prevent Defects: Establishes Quality Assurance (QA) processes to proactively “build in” quality from the start, reducing the risk of errors.
  • Detect and Correct Issues: Outlines Quality Control (QC) activities, such as testing and inspections, to identify and fix defects before they reach the customer.
  • Clarify Accountability: Assigns specific roles and responsibilities so every team member knows who is responsible for performing, checking, and approving work.
  • Ensure Compliance: Guarantees the project adheres to relevant internal policies, legal regulations, and industry standards like ISO 9001. 

Strategic Benefits

Implementing a structured quality plan provides tangible advantages for project management: 

  • Reduced Costs and Rework: By catching errors early, the team avoids expensive last-minute fixes and wasted resources.
  • Improved Efficiency: Standardised workflows and clear metrics allow the team to focus on production rather than constant troubleshooting.
  • Increased Stakeholder Trust: Providing objective evidence through audits and reports gives sponsors and clients confidence in the final outcome.
  • Continuous Improvement: The plan often includes feedback loops and lessons-learned processes to refine and enhance quality for future project phases.

Project Quality Plan PQP in QA/QC Overview

Technical Program Manager Roadmap

Technical Program Manager Roadmap

Agile Scrum Methodology Summary Breakdown Overview

Scrum is lightweight framework within the broader Agile methodology used to manage complex work through iterative, incremental delivery. It organizes work into fixed-length cycles called sprints, typically lasting two to four weeks, to deliver a usable “increment” of value at the end of each cycle. 

Core Components (The 3-5-3 Structure)

The framework is built around three accountabilities, five events, and three artifacts. 

1. Three Accountabilities (Roles)

  • Product Owner: Represents the customer and stakeholders. They manage the Product Backlog and prioritize work to maximize the value delivered by the team.
  • Scrum Master: A servant leader who coaches the team on Scrum theory and removes impediments that block progress.
  • Developers: A cross-functional, self-managing team that does the actual work to create the product increment. 

2. Five Events (Ceremonies)

  • The Sprint: The container for all other events; a time-boxed period where work is performed.
  • Sprint Planning: The team defines what will be delivered in the sprint and how the work will be achieved.
  • Daily Scrum: A 15-minute daily check-in for developers to synchronize progress and plan the next 24 hours.
  • Sprint Review: Held at the end of the sprint to inspect the outcome with stakeholders and adapt the Product Backlog.
  • Sprint Retrospective: An internal team meeting to reflect on the process and identify improvements for the next sprint. 

3. Three Artifacts

  • Product Backlog: An ordered, evolving list of everything needed for the product.
  • Sprint Backlog: The subset of product backlog items selected for the current sprint, plus a plan for delivering them.
  • Increment: The concrete sum of all completed backlog items that meet the Definition of Done. 

The Three Pillars of Empiricism

Scrum is founded on empirical process control, which relies on: 

  1. Transparency: The process and work must be visible to everyone involved.
  2. Inspection: Frequent checks of artifacts and progress to detect variances.
  3. Adaptation: Adjusting the process or product if an inspection reveals unacceptable deviations. 

Key Values

Success with Scrum depends on the team’s commitment to five core values: Commitment, Courage, Focus, Openness, and Respect

Agile Scrum Methodology Summary Breakdown Overview

PRINCE2 Management Stages Overview

In PRINCE2, a project is managed through a series of management stages, which are discrete sections of a project that the Project Board authorises at specific decision points. Every PRINCE2 project must have at least two stages: an initiation stage and at least one further delivery stage

PRINCE2 Management Stages Overview

A detailed breakdown of these stages, aligned with the seven core PRINCE2 processes, is provided below. 

1. Starting Up a Project (SU)

This is a pre-project process designed to determine if the project is viable and worthwhile before committing significant resources. 

  • Key Activities:
    • Appointing the Executive and Project Manager.
    • Developing an Outline Business Case.
    • Creating a Project Brief which defines objectives and scope.
    • Planning the initiation stage itself. 

2. Initiating a Project (IP)

This represents the first management stage of the project. It establishes the firm foundation for the project’s execution. 

  • Key Activities:
    • Creating the Project Initiation Documentation (PID), which includes the full Business Case, Project Plan, and management strategies for risk, quality, and communication.
    • Setting up project controls and refining the project approach.
    • Securing formal approval from the Project Board to proceed. 

3. Directing a Project (DP)

This is an ongoing process that spans the entire project lifecycle, focusing on high-level decision-making by the Project Board. 

  • Key Activities:
    • Authorising the project to start and approving each subsequent stage.
    • Giving ad hoc direction and advice to the Project Manager.
    • Making the final “stop/proceed” decisions at stage boundaries.

4. Controlling a Stage (CS)

This covers the day-to-day management of each delivery stage by the Project Manager. 

  • Key Activities:
    • Assigning work to teams via Work Packages.
    • Monitoring progress and managing risks and issues.
    • Reporting status to the Project Board through Highlight Reports

5. Managing Product Delivery (MP)

This process manages the link between the Project Manager and the Team Managers who are actually building the products

  • Key Activities:
    • Teams accepting and executing Work Packages.
    • Ensuring work meets the specified quality standards.
    • Delivering completed and tested products back to the Project Manager. 

6. Managing a Stage Boundary (SB)

This occurs at the end of each stage (except the final one) to help the Project Board decide whether to continue. 

  • Key Activities:
    • Reporting on the performance of the current stage.
    • Creating a detailed Stage Plan for the next stage.
    • Updating the overall Project Plan and Business Case with the latest information. 

7. Closing a Project (CP)

This is the final part of the last management stage, ensuring the project is shut down in a controlled manner. 

  • Key Activities:
    • Confirming all products have been accepted by the customer.
    • Capturing Lessons Learned for future projects.
    • Preparing an End Project Report to evaluate performance against the original plan.

PRINCE2 Management Stages Overview

Essential Requirements Practices for a Business Analyst

Essential Requirements Practices for a Business Analyst

PRINCE2 7 Themes / Practices of PRINCE2

In the PRINCE2 project management methodology, Themes (renamed to Practices in the 7th edition released in 2023) are the seven functional areas of project management that must be addressed continuously throughout the project lifecycle. They provide a structured framework for managing key aspects like cost, risk, and quality to ensure the project remains on track. 

7 Themes / Practices of PRINCE2

Overview of the Seven Themes (Practices)

  • Business Case: Focuses on the “Why” of the project. It establishes the justification for the investment and ensures the project remains desirable, viable, and achievable.
  • Organisation: Addresses the “Who” by defining the project’s structure of accountability and responsibilities. It identifies key stakeholders and establishes the project management team.
  • Quality: Focuses on the “What” by defining the user’s requirements and quality standards. It ensures that deliverables are fit for purpose and meet stakeholder expectations.
  • Plans: Describes the “How,” “How Much,” and “When”. This theme provides techniques for creating project, stage, and team plans to facilitate communication and control.
  • Risk: Manages the “What If” by identifying, assessing, and controlling uncertainties that could impact the project’s objectives, whether they are threats or opportunities.
  • Change (Issues): Deals with the impact of changes and unexpected events. It provides a formal process for capturing, assessing, and controlling requests for change to project baselines.
  • Progress: Evaluates “Where are we now?” versus “Where are we going?”. It establishes mechanisms to monitor actual achievements against planned outcomes and manage deviations through tolerances. 

Key Concepts and Terminology

  • Continuous Application: Unlike processes, which follow a sequence, themes are applied simultaneously throughout the project.
  • Tolerances: Each theme uses tolerances (allowable deviations for time, cost, quality, etc.) to support the principle of Manage by Exception.
  • PRINCE2 7 Updates: The latest edition introduces Sustainability as a 7th performance target and emphasizes People as a core element alongside Principles, Practices, and Processes.

PRINCE2 Process Model Overview

PRINCE2 Process Model

The PRINCE2 process model provides a structured, process-driven roadmap for managing a project from its initial conception to formal closure. It consists of seven core processes that define specific activities, responsibilities, and decision points across the project lifecycle. 

The 7 PRINCE2 Processes

The processes are designed to ensure control and align with the project’s management levels: 

  • Starting Up a Project (SU): A pre-project process that filters out unviable ideas. It focuses on confirming if there is a “viable and worthwhile” business case and appoints the Project Manager and Executive.
  • Directing a Project (DP): Spans the entire project from start to finish. It is the responsibility of the Project Board, which provides strategic oversight, makes key decisions (e.g., authorising stages), and manages by exception.
  • Initiating a Project (IP): Occurs during the first management stage. It involves detailed planning to establish solid foundations, resulting in the Project Initiation Documentation (PID), which includes the project plan, risk management approach, and full business case.
  • Controlling a Stage (CS): Focuses on the Project Manager’s day-to-day management of a stage. This includes assigning work to teams, monitoring progress, and dealing with issues or risks within agreed tolerances.
  • Managing Product Delivery (MP): Governs the link between the Project Manager and Team Managers. It is where the “specialist products” (actual deliverables) are created, quality-checked, and delivered.
  • Managing a Stage Boundary (SB): Occurs at the end of each management stage (except the final one). The Project Manager reviews the current stage, updates the project plan and business case, and plans the next stage for Board approval.
  • Closing a Project (CP): Ensures an orderly end to the project. It confirms that objectives have been met, products have been accepted by the user, and lessons are captured before the project is formally disbanded. 

Hierarchy of Management Levels

The process model operates across four distinct levels of authority: 

  1. Corporate or Programme Management: Sets the initial project mandate.
  2. Directing (Project Board): Responsible for overall governance and major decisions (Directing a Project).
  3. Managing (Project Manager): Handles daily management and stage control (Controlling a Stage, Initiating a Project).
  4. Delivering (Team Members/Managers): Focuses on creating the physical products (Managing Product Delivery). 

Key Characteristics

  • Management Stages: Projects are broken into at least two stages (Initiation and at least one Delivery stage) to provide “stop/go” decision points.
  • Triggers: Each process is activated by a specific trigger, such as a “Project Mandate” from corporate management to start the SU process.
  • Management Products: These are documents like the Business CaseProject Brief, and Highlight Reports used to facilitate control and communication.

PRINCE2 (PRojects IN Controlled Environments) framework is built on seven core principles

PRINCE2 framework is built on seven core principles

The PRINCE2 (PRojects IN Controlled Environments) framework is built on seven core principles that serve as guiding obligations for any project using this methodology. For a project to be considered a “PRINCE2 project,” all seven must be applied. 

  • Continued Business Justification: A project must have a valid reason to start and must remain justified throughout its lifecycle. This is documented in a Business Case, which is regularly reviewed to ensure the project remains viable, desirable, and achievable.
  • Learn from Experience: Project teams are required to seek out lessons from previous projects and record new lessons as the current project progresses. A Lessons Log is typically used to capture these insights.
  • Defined Roles and Responsibilities: Every person involved must understand what is expected of them and who is responsible for specific tasks. PRINCE2 defines a clear management hierarchy: Project Board (Direction), Project Manager (Management), and Team Manager (Delivery).
  • Manage by Stages: Projects are broken down into manageable chunks called management stages. Each stage acts as a “stop/continue” decision point for the Project Board to assess progress before committing more resources.
  • Manage by Exception: Senior management (Project Board) only intervenes when the project deviates beyond agreed tolerances for time, cost, quality, scope, risk, or benefits. This empowers the Project Manager while ensuring efficient use of executive time.
  • Focus on Products: The methodology prioritizes the definition and delivery of high-quality products (outputs) rather than just completing activities. Product descriptions specify the quality criteria and requirements for each deliverable.
  • Tailor to Suit the Project: PRINCE2 is not a rigid “one-size-fits-all” approach; it must be adapted to the project’s specific scale, complexity, and environment. Tailoring ensures that the controls are appropriate for the level of risk involved. 

Agile Framework Executive Summary Overview Snapshot

Agile Framework Executive Summary Overview Snapshot

RACI Matrix to Eliminate Role Confusion in Projects

RACI Matrix to Eliminate Role Confusion in Projects

Understanding Project Management Frameworks

Understanding Project Management Frameworks

Theory of Constraints (TOC) Overview and Timeline History

The Theory of Constraints (TOC) is a management philosophy introduced by Dr. Eliyahu M. Goldratt in his 1984 bestselling business novel, The Goal

At its core, TOC operates on a simple premise: A chain is only as strong as its weakest link. In any complex system—be it a manufacturing plant, a hospital, or a software team—there is always one specific constraint (bottleneck) that limits the system from achieving more of its goal. If you improve anything other than that constraint, you are wasting your time. 

The Five Focusing Steps

TOC uses a rigorous five-step process for continuous improvement: 

  1. Identify the constraint.
  2. Exploit the constraint (ensure it doesn’t waste time).
  3. Subordinate everything else (align the whole system to support the constraint).
  4. Elevate the constraint (invest in more capacity if steps 2 and 3 weren’t enough).
  5. Repeat (prevent inertia; find the next bottleneck). 

Annotated Timeline of TOC Evolution

  • 1979 – Optimized Production Technology (OPT): Goldratt introduces OPT, a scheduling software that challenged traditional cost accounting by focusing on throughput.
  • 1984 – The Goal Published: Goldratt pivots from software to education. He uses a fictional story to introduce the Drum-Buffer-Rope (DBR) method and the concept of “Throughput Accounting.”
  • 1990 – The Haystack Syndrome: This marks the shift toward formalising TOC metrics: Throughput (money coming in), Inventory (money stuck inside), and Operating Expense (money going out).
  • 1994 – It’s Not Luck: Goldratt introduces the Thinking Processes (TP)—a set of logical tools (like the Current Reality Tree) used to solve complex problems and overcome resistance to change.
  • 1997 – Critical Chain: TOC is applied to Project Management. This introduced “buffers” at the end of project paths rather than individual tasks, drastically reducing project durations.
  • 2003 – Strategy & Tactic (S&T) Trees: A framework developed to synchronise large-scale organisational change, ensuring every action aligns with the ultimate goal.
  • 2000s–Present – Throughput Economics: Integration of TOC with Lean and Six Sigma (often called TLS) becomes the gold standard for high-performance manufacturing. 

Theory of Constraints (TOC) Overview and Timeline History

Project Management, Pre-Contract vs Post- Contract Phase

Project Management, Pre-Contract vs Post- Contract Phase

Project Management, Servant Leadership

Project Management, Servant Leadership

Critical Chain Project Management (CCPM) Overview and Timeline

Critical Chain Project Management (CCPM) represents a paradigm shift in how timelines are managed, moving away from traditional task-based safety to system-wide buffers. Its history is deeply rooted in the Theory of Constraints (TOC) and evolved through four primary eras of modern project management

The Foundations: Pre-1958 

Before the formal creation of CCPM, the industry relied on “craft-based” approaches and the early Gantt Chart (1910s) to visualize task durations. During this era, projects like the Hoover Dam (1931) and the Manhattan Project proved that large-scale coordination was possible, but they lacked a systematic way to handle resource constraints or project-wide uncertainty. 

The Traditional Era: 1958 – 1979 

This period saw the birth of the “Critical Path,” the ancestor of the “Critical Chain.” 

  • 1957: The Critical Path Method (CPM) was invented by the DuPont Corporation to manage chemical plant maintenance.
  • 1958: The Program Evaluation Review Technique (PERT) was developed for the U.S. Navy’s Polaris Project, introducing probabilistic task durations.
  • The Limitation: While these methods identified the longest sequence of tasks, they often ignored resource availability, leading to frequent delays and “multitasking” inefficiencies. 

The Conceptual Era: 1980 – 1994 

The theoretical seeds for CCPM were planted during the rise of the personal computer and the introduction of a new management philosophy.

  • 1984: Dr Eliyahu M. Goldratt published his seminal business novel, The Goal, introducing the Theory of Constraints (TOC).
  • Core Principle: Goldratt argued that every system has at least one constraint that limits its output. Managing this “bottleneck” is the key to overall performance.
  • Focus Shift: Organizations began looking at “flow” rather than just individual task completion. 

The CCPM Era: 1995 – Present 

CCPM was formally introduced as a distinct methodology to address the failures of traditional CPM. 

  • 1997: Goldratt published the book “Critical Chain”, officially launching the method.
  • Key Innovations: Unlike CPM, the Critical Chain accounts for both task dependencies and resource constraints. It replaced individual task “safety margins” with:
    • Project Buffers: A collective time safety net placed at the end of the project.
    • Feeding Buffers: Placed where non-critical tasks feed into the critical chain to prevent delays.
    • Fever Charts: A new visual tool for tracking buffer consumption rather than just task deadlines.
  • Modern Integration: In the 21st century, CCPM has been integrated with Agile and Lean practices to help organizations manage multi-project pipelines and global resource pools. 

Critical Chain Project Management (CCPM) timelines differ from traditional methods by shifting safety margins from individual tasks to strategic buffers at the end of the project or at integration points. This approach accounts for both task dependencies and resource constraints to determine the “Critical Chain”—the true longest path in a project. 

Core Components of a CCPM Timeline

  • The Critical Chain: The longest sequence of dependent tasks, adjusted for resource availability.
  • Aggressive Task Estimates: Tasks are estimated at a 50% confidence level (how long it takes if things go well) rather than the traditional 90% (safe) estimate.
  • Project Buffer: A single aggregate buffer placed at the very end of the project to protect the final delivery date.
  • Feeding Buffers: Placed at points where non-critical task sequences (feeding chains) merge into the critical chain, preventing delays in minor tasks from affecting the main timeline.
  • Resource Buffers: Virtual markers or alerts placed before critical tasks to ensure that key resources (people or equipment) are ready to start exactly when needed.
CCPM versus Traditional Timeline (CPM)

Implementing a CCPM Timeline

  1. Identify the Critical Path: Map the logical sequence of tasks.
  2. Level Resources: Adjust the schedule so no single resource is over-allocated, transforming the path into a Critical Chain.
  3. Strip Task Padding: Reduce task durations by roughly 50% to eliminate “Student Syndrome” (procrastinating until the last minute).
  4. Insert Buffers: Add a Project Buffer (typically 50% of the chain’s length) at the end and Feeding Buffers where non-critical paths merge.
  5. Monitor via Fever Chart: Use a Fever Chart to track if the buffer is being consumed faster than tasks are being completed.

Critical Chain Project Management (CCPM) Overview and Timeline

Critical Path Method CPM Overview and Timeline by year

The Critical Path Method (CPM) is a mathematical algorithm used for scheduling a set of project activities. It identifies the longest sequence of dependent tasks required to complete a project, which in turn determines the shortest possible duration to finish it. 

Timeline of the Critical Path Method

The evolution of CPM is categorised into four primary eras, moving from manual mathematical foundations to modern AI-driven automation. 

1. Pre-Formalisation Era (1940s – Early 1950s) 

  • 1940–1943: DuPont develops precursor techniques for scheduling that are applied to the Manhattan Project.
  • Early 1950s: Growing complexity in industrial plants leads to “scheduling crises,” where traditional Gantt charts are no longer sufficient for managing thousands of interdependent tasks. 

2. The Development & Mainframe Era (1956 – 1969)

  • 1956: Morgan R. Walker of DuPont and James E. Kelley Jr. of Remington Rand begin collaborative research to improve plant maintenance scheduling.
  • 1957–1958: The duo formalises the Critical Path Method (CPM).
  • 1958: The U.S. Navy and Booz Allen Hamilton develop the Program Evaluation and Review Technique (PERT) for the Polaris missile program; it is from this project that the term “critical path” is actually coined.
  • 1959: The first computer-based CPM is implemented on a UNIVAC mainframe, allowing DuPont to reduce plant maintenance downtime from 125 to 78 hours.
  • 1966: CPM is used for the first time in a massive skyscraper project for the construction of the World Trade Center Twin Towers in New York City. 

3. The PC Revolution & Methodology Expansion (1970s – 1999) 

  • 1970s: Dedicated project management software companies like Oracle (then Software Development Laboratories) begin to emerge.
  • 1984: Eliyahu M. Goldratt introduces the Theory of Constraints (TOC), which later influences the development of the Critical Chain.
  • 1980s: The advent of the Personal Computer (PC) makes CPM accessible to smaller companies, moving it away from expensive, bulky mainframes.
  • 1997: Eliyahu M. Goldratt introduces Critical Chain Project Management (CCPM), a more sophisticated evolution of CPM that accounts for resource constraints and buffers. 

4. Modern Era: Digital Integration & AI (2000 – Present) 

  • 2000s–2010s: CPM becomes a standard feature in cloud-based tools like AsanaWrike, and Microsoft Project, allowing for real-time schedule updates.
  • 2020: The COVID-19 pandemic accelerates the adoption of virtual project management tools, where CPM is used to manage remote, globally distributed teams.
  • 2025–Present: Artificial Intelligence is increasingly used to predict risks and automatically calculate “crashing” scenarios (reducing task duration to shorten the overall project) based on historical data.
Summary of Key CPM Concepts

Critical Path Method CPM Overview and Timeline by year

Project Scope vs Project Scope Statement in Project Management

Project Scope vs Project Scope Statement in Project Management

Program Evaluation and Review Technique (PERT) Timeline by era and year

The Program Evaluation and Review Technique (PERT) is a statistical project management tool designed to analyse and represent the tasks involved in completing a project. It is particularly effective for large-scale, complex, and non-routine initiatives—such as Research and Development (R&D)—where task durations are uncertain. 

Overview of PERT

  • Purpose: To identify the critical path and the minimum time required to complete a project.
  • Core Mechanism: Uses a three-point estimation method for each task:
    • Optimistic time (O): The shortest possible time.
    • Most likely time (M): The most realistic duration.
    • Pessimistic time (P): The longest time if major setbacks occur.
  • Formula: The Expected Time () is calculated as .
  • Visualisation: Tasks are represented as nodes (circles or rectangles) and dependencies as arrows.

Timeline History by Era

The history of PERT is defined by its transition from a secretive Cold War military tool to a foundational standard in global project management.

1. The Era of Inception (1956–1959)

This era was marked by the urgent need for a massive deterrent during the Cold War. 

  • 1956: The Polaris Project (Fleet Ballistic Missile program) began, facing the immense challenge of building nuclear-powered submarines capable of launching solid-propellant missiles.
  • 1958: PERT was officially developed by the U.S. Navy Special Projects Office, specifically by Charles E. Clark. It was initially called “Program Evaluation Research Task”.
  • 1958: Around the same time, the Critical Path Method (CPM) was independently developed by the DuPont Corporation.
  • 1959: The technique was renamed to “Program Evaluation and Review Technique”. 

2. The Era of Expansion & Mandates (1960–1975)

During this period, PERT moved from military use into government mandates and international visibility. 

  • 1960: The Polaris program, managed via PERT, achieved its first successful underwater launch and was completed 18 months to two years ahead of schedule.
  • 1962: The U.S. Department of Defense mandated the Work Breakdown Structure (WBS) as part of the PERT approach for all future projects of this size.
  • 1965–1968: One of the first large-scale civilian applications of PERT occurred during the planning of the Winter Olympic Games in Grenoble, France.
  • Late 1960s: PERT was adopted by major public programs globally, including the UK’s nuclear power programs and Sweden’s fighter jet development. 

3. The Era of Professionalization (1976–1999)

Project management began to coalesce into a formal academic and professional discipline. 

  • 1987: The Project Management Institute (PMI) published the first PMBOK Guide (Project Management Body of Knowledge), which included and standardised PERT and CPM concepts.
  • 1989Earned Value Management (EVM), which grew out of early PERT/Cost frameworks, became a mandatory part of U.S. government procurement.
  • 1998: The PMBOK Guide was recognised as a standard by the American National Standards Institute (ANSI). 

4. The Modern Era (2000–Present)

PERT has transitioned from hand-drawn charts to being integrated into digital ecosystems. 

  • 2000s: PERT concepts became core features in project management software (like Microsoft Project), where the math is often automated behind the user interface.
  • 2020s: Emerging trends include AI-enhanced estimations, where machine learning algorithms analyse historical project data to generate the optimistic, pessimistic, and most likely time estimates more accurately than human experts.

Program Evaluation and Review Technique (PERT) Timeline by era and year

Gantt Chart Detailed Timeline History by Era and Year

Henry Gantt (1861–1919) was an American mechanical engineer and management consultant who revolutionized project management by introducing visual tools to track work against time. A close associate of Frederick Taylor, he humanized “scientific management” by focusing on employee motivation and social responsibility alongside industrial efficiency. 

Gantt Chart in MS Project, templates can be downloaded at website banner link

Overview of Henry Gantt’s Contributions

  • The Gantt Chart: His most famous invention, a horizontal bar chart that illustrates a project schedule, including task durations and progress.
  • Task and Bonus System: A wage system that guaranteed a base rate but offered bonuses to workers who exceeded daily production goals.
  • Social Responsibility: He argued that businesses have a moral obligation to the welfare of the society in which they operate, not just to their owners.
  • Industrial Efficiency: He advocated for using scientific analysis to eliminate “chance and accidents” in manufacturing. 

Comprehensive Gantt Timeline History

Era 1: Pre-Gantt & Early Origins (1765–1896)

  • 1765: Joseph Priestley creates early timeline charts, which some consider the conceptual distant ancestors of the Gantt chart.
  • 1896: Polish engineer Karol Adamiecki develops the “Harmonogram,” a precursor that displayed interdependent processes. However, he published it only in Polish and Russian, limiting its global recognition. 

Era 2: The Henry Gantt Era (1903–1919)

  • 1903: Henry Gantt develops his first version of a production chart for the American Locomotive Company.
  • 1910–1915: Gantt refines and popularizes his chart through articles and his book Work, Wages and Profits (1910).
  • 1917–1918: At the request of General William Crozier, Gantt charts are used to manage massive military production for the U.S. during World War I.
  • 1919: Henry Gantt passes away. 

Era 3: Global Adoption & Infrastructure (1920s–1970s) 

  • 1922: Wallace Clark, a colleague of Gantt, publishes The Gantt Chart: A Working Tool of Management, leading to international adoption.
  • 1929: Walter Polakov introduces Gantt charts to the Soviet Union for their First Five Year Plan.
  • 1931–1936: Gantt charts are used on massive infrastructure projects like the Hoover Dam and later the U.S. Interstate highway system.
  • 1940s: Extensively used for logistics and military project management during World War II.
  • 1950s: Become a staple in the construction and engineering industries; the first digital predecessors like PERT and Critical Path Method (CPM) emerge. 

Era 4: The Digital Revolution (1980s–Present) 

  • 1980s: The advent of personal computers allows project managers to create and update charts without redrawing them by hand.
  • 1990s: Software like Microsoft Project adds “link lines” to display complex dependencies between tasks.
  • 2000s–2010s: Web-based and cloud-based applications (like Jira or Asana) integrate Gantt charts for real-time team collaboration.
  • Present: Modern tools use AI to automate chart maintenance and predict risks based on historical data.

Gantt Chart Detailed Timeline History by Era and Year

Budgeting vs Forecasting, Financial Concepts overview

Budgeting vs Forecasting, Financial Concepts overview

Project Management and Cost Control

Project Management and Cost Control

Rational Unified Process RUP Overview and Timeline History

The Rational Unified Process (RUP) timeline is a two-dimensional framework where the horizontal axis represents time (divided into phases and iterations) and the vertical axis represents work/activities (divided into disciplines)

Rational Unified Process, RUP

The process is structured into four sequential phases, each culminating in a major milestone where the project’s progress is assessed before moving forward. 

RUP Phases, Iterations and Workflows

RUP Project Phases and Milestones

Each phase of the RUP lifecycle has a specific objective and a corresponding milestone. 

  • Inception Phase
    • Goal: Define project scope, identify business risks, and establish the Business Case.
    • MilestoneLifecycle Objective Milestone – Stakeholders agree on scope and cost/schedule estimates.
  • Elaboration Phase
    • Goal: Analyze requirements in detail and design a stable Software Architecture.
    • MilestoneLifecycle Architecture Milestone – The architecture is validated and major risks are mitigated.
  • Construction Phase
    • Goal: Build the software system by developing and testing all components and features.
    • MilestoneInitial Operational Capability Milestone – A product is ready for beta testing by users.
  • Transition Phase
    • Goal: Deploy the software to the end users and perform final Beta Testing and training.
    • MilestoneProduct Release Milestone – The development cycle is finished and the product is formally accepted. 

Detailed Iteration Timeline

Within each phase, work is performed in iterations (typically lasting 2 to 6 weeks). Each iteration is a mini-lifecycle that includes: 

  1. Requirements Analysis: Refining what needs to be built.
  2. Design: Modeling the system architecture and components.
  3. Implementation: Writing the code for specific features.
  4. Testing: Verifying the quality of the iteration’s output.
  5. Assessment: Evaluating the iteration against its planned goals. 

Historical Development Timeline

  • 1988Objectory AB defines the core process.
  • 1995: Rational Software Corporation acquires Objectory.
  • 1998: RUP 5.0 is released, introducing UML integration.
  • 2003: IBM acquires Rational Software.
  • 2012: RUP is largely succeeded by Disciplined Agile Delivery (DAD) and SAFe.

Rational Unified Process RUP Overview and Timeline History

A Practical Guide to the Rational Unified Process RUP

Setting up effective meetings

Setting up effective meetings