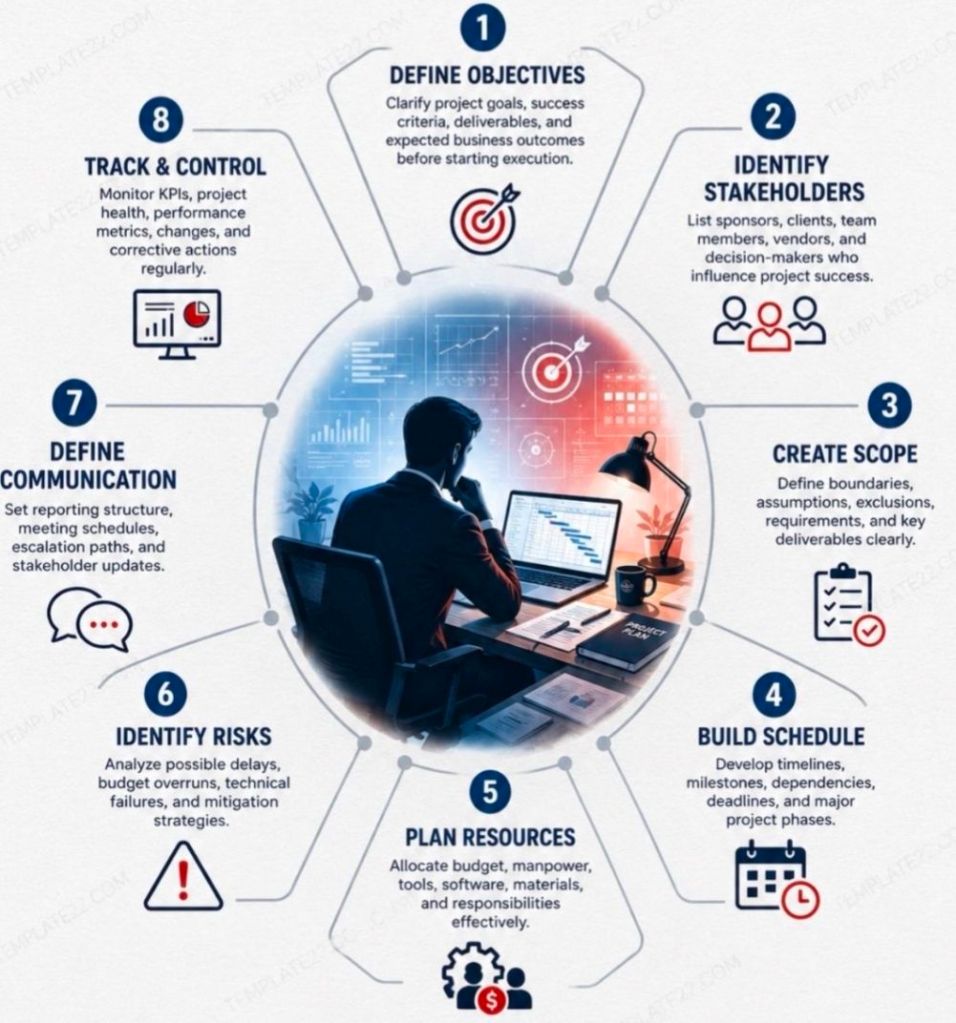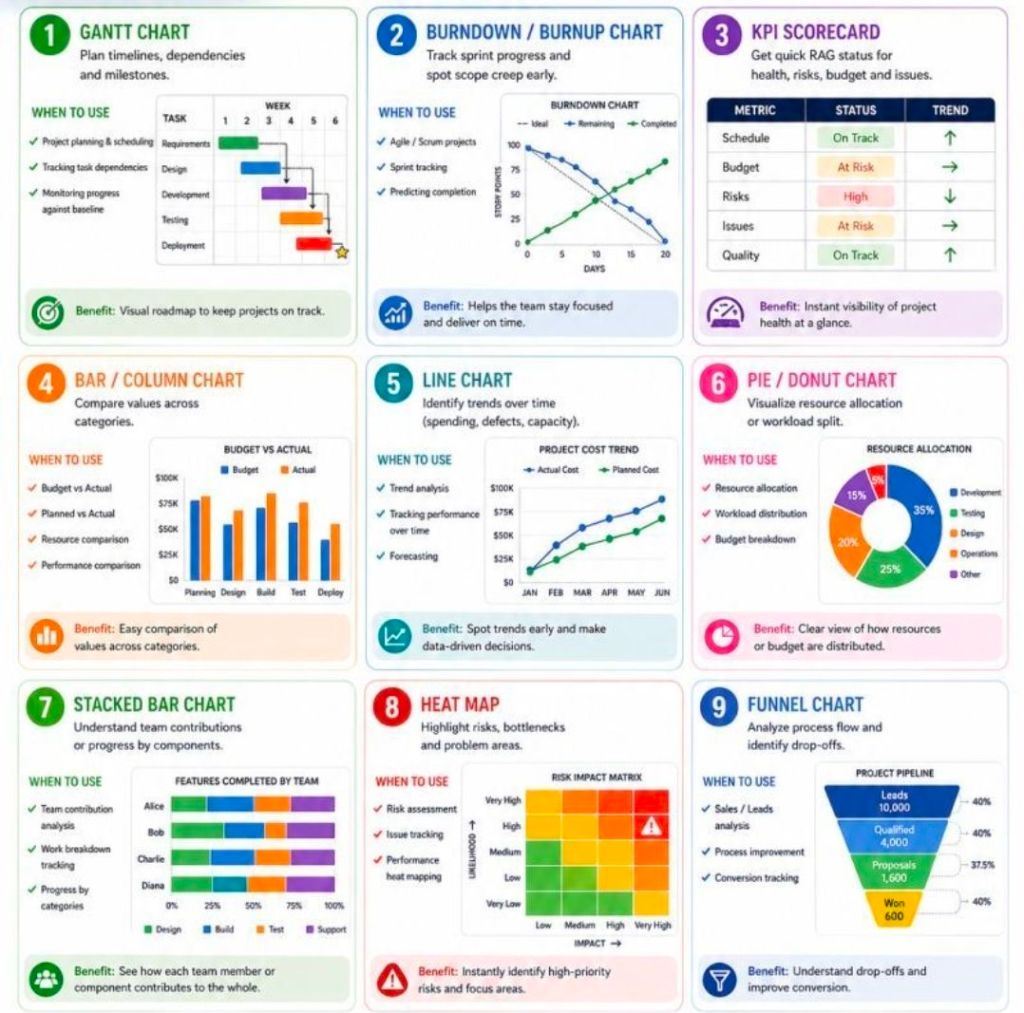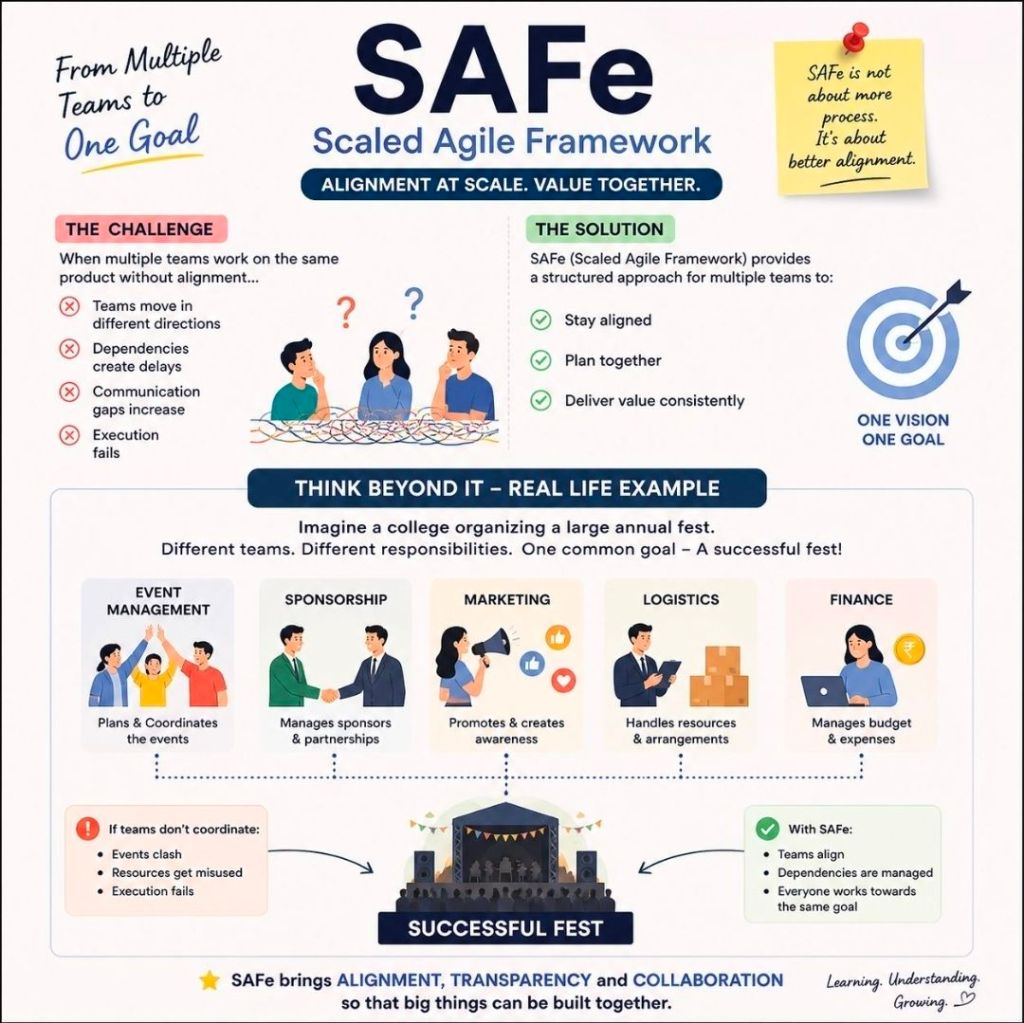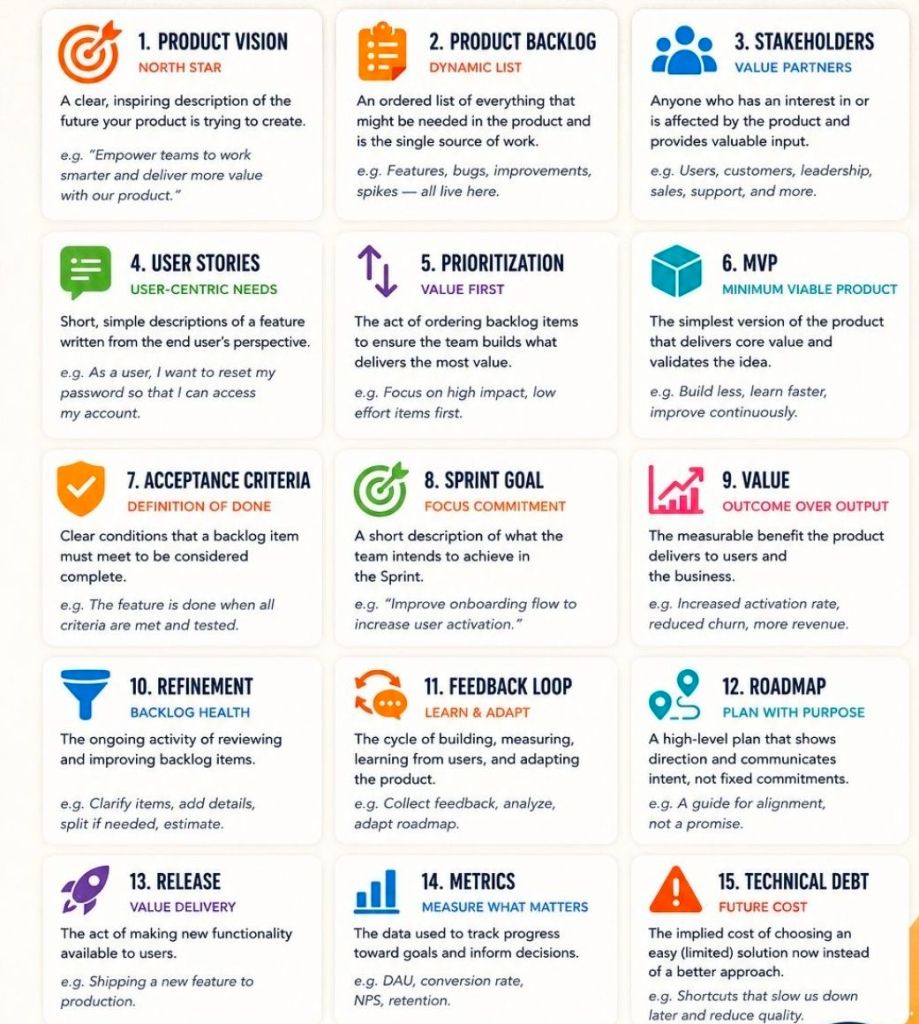
Lean Six Sigma Global, How to Lead a Project

Lean Six Sigma Global, How to Lead a Project

Agile Daily Scrum Checklist Overview

Agile Daily Scrum Checklist Overview

BA Business Analyst in a Software Development Project

Business Analyst BA in a Software Development Project
BA in a Software Development Project

Microsoft Excel Project Backlog template & Work in Progress WIP

A Microsoft Excel project backlog template is a prioritized, centralized list of all pending work—features, user stories, bug fixes, and tasks—that need to be completed, often used in Agile, Scrum, or Kanban frameworks to manage team workload and project scope. 

Key Columns for an Effective Backlog Template

To create a detailed backlog, the following columns are essential for tracking, prioritizing, and assigning work items: 

  • ID / Task Number: A unique identifier for each item (e.g., P-001, P-002) for easy referencing.
  • Item Name / Title: A concise title describing the task or requirement.
  • User Story / Description: A detailed description of the work, often in the format: “As a [type of user], I want to [action], so that [value]”.
  • Type: Categorizes the work (e.g., Feature, Bug, Improvement, Technical Debt).
  • Priority: Defines the order of execution, typically Rank (1, 2, 3), High/Medium/Low, or MoSCoW (Must-have, Should-have, Could-have, Won’t-have).
  • Status: Indicates the current stage of the item (e.g., Backlog, To-Do, In Progress, Testing, Done).
  • Assignee / Owner: The team member responsible for completing the item.
  • Story Points / Effort Estimate: An estimated size of the task (e.g., using Fibonacci sequence: 1, 2, 3, 5, 8…).
  • Acceptance Criteria: Specific conditions that must be met for the item to be marked as “Done”.
  • Target Sprint / Release: The planned iteration or release version in which the task is scheduled. 

Example Structure for MS Excel Project Backlog

This structure can be implemented in a simple Microsoft Excel sheet, enabling filtering and sorting by priority or assignee. 

Example Structure for MS Excel Project Backlog

Detailed Overview of Functional Features

  • Drop-down Menus (Data Validation): Use these for “Status,” “Priority,” and “Type” columns to maintain data consistency.
  • Conditional Formatting: Automatically color-code rows based on status (e.g., “Done” turns green) or priority (e.g., “High” turns red) to visually identify bottlenecks.
  • Formulas: Implement formulas to calculate total story points or project completion percentage.
  • Filtering: Use filtering on column headers to immediately view specific categories or an assignee’s workload. 

Related Agile Templates in MS Excel

  • Sprint Backlog: Contains only items selected from the main Product Backlog for the current 2-4 week sprint.
  • Kanban Board View: Organizes the backlog into vertical columns representing stages of workflow (Backlog, In Progress, Done).
  • Burndown Chart: Uses data from the backlog to plot remaining work hours over the course of a sprint.

……….

Project Work in Progress or WIP

A Work in Progress (WIP) template in Microsoft Excel serves two primary purposes depending on your industry: operational task tracking for project management or financial reporting for construction and contracting. 

1. Essential Columns for Operational WIP (Project Management) 

This format focuses on day-to-day task execution and risk management. 

  • Task / Activity: Clear description of the work being done (e.g., “Design Phase Sign-off”).
  • Owner / Assigned To: Name of the person or team responsible for the task.
  • Due Date: The critical deadline for task completion.
  • Status: Current state of the task, typically using a dropdown menu for “Not Started,” “In Progress,” “Blocked,” or “Complete”.
  • % Complete: A numerical value (0–100%) providing granular visibility into progress.
  • Priority: Categorisation of importance (High, Medium, Low) to help teams focus on critical items.
  • Notes / Blockers: Documentation of risks, dependencies, or reasons for delay. 

2. Essential Columns for Financial WIP (Construction/Contracting)

This format bridges financial data with project completion to calculate earned revenue and billing accuracy.

Essential MS Excel Columns for Financial WIP (Construction/Contracting)

Advanced Template Features

  • Status Dashboard: A summary section at the top of the sheet displaying overall project health, risks, and budget status.
  • Data Validation: Using dropdown lists for the “Status” and “Budget” columns to ensure consistent data entry.
  • Conditional Formatting: Using color-coded indicators (Red, Yellow, Green) for at-risk tasks or budget overruns.
  • Freeze Panes: Locking the header rows so they remain visible while scrolling through long task lists. 

Microsoft Excel Project Backlog template & Work in Progress WIP

……….

Summary of ‘Project Backlog’ columns in Excel

  1. ID / Task Number
  2. Item Name / Title
  3. User Story / Description
  4. Type
  5. Priority
  6. Status
  7. Assignee / Owner
  8. Story Points / Effort Estimate
  9. Acceptance Criteria
  10. Target Sprint / Release

……….

Summary of (Project Management) ‘Operational’ Work in Progress (WIP) columns in Excel

  1. Task Activity
  2. Owner / Assigned To
  3. Due Date
  4. Status
  5. % Complete
  6. Priority
  7. Notes / Blockers

……….

Summary of (Construction / Contracting) ‘Financial’ Work in Progress (WIP) columns in Excel

  1. Contract Data
  2. Cost Tracking
  3. Forecasting
  4. Progress
  5. Revenue
  6. Billing
  7. Variance

……….

End> Microsoft Excel Project Backlog template & Work in Progress WIP

Every Artificial Intelligence AI Agent Explained

Every Artificial Intelligence AI Agent Explained

Agile Backlog Refinement Activities and Business Analyst BA

Agile Backlog Refinement Activities & Business Analyst

Twin Peaks Story Overview and Timeline by Era

Twin Peaks is a landmark surrealist mystery-horror drama created by David Lynch and Mark Frost, premiering in 1990. It blends a small-town soap opera with supernatural horror, focusing on the investigation into the murder of homecoming queen Laura Palmer. The story unfolds across two television seasons (1990–1991), a prequel film (Fire Walk with Me), and a revival season (The Return), with significant, often contradictory lore found in tie-in books like The Secret History of Twin Peaks

Twin Peaks is a landmark surrealist mystery-horror drama

Full Overview

  • The Premise: FBI Special Agent Dale Cooper travels to the fictional town of Twin Peaks, Washington, to investigate the murder of popular high school student Laura Palmer.
  • The Conflict: The investigation uncovers deep, dark secrets hidden behind the town’s idyllic facade, including the involvement of an ancient, malevolent supernatural entity named “BOB,” who possesses people to commit atrocities.
  • The Supernatural World: The story centers on two metaphysical realms: the White Lodge (associated with good) and the Black Lodge (associated with evil), often referred to together as “The Lodges”.
  • The Structure: Fire Walk with Me provides the final week of Laura’s life, while Season 3 (The Return) takes place 25 years later, dealing with the consequences of the original series and alternate realities. 

Detailed Historic Timeline by Era and Year

Ancient Era – 19th Century: Founding and Entities

  • ~1,000,000,000 B.C.: The future site of Twin Peaks is on the western coast of Pangea.
  • 1805: Meriwether Lewis (of Lewis and Clark) visits the area, specifically the Owl Cave lodges, and is believed to have encountered the supernatural forces.
  • 1872: The town of Twin Peaks is established.
  • 1879: Miners accidentally discover Owl Cave.
  • 1896: “The Terrible Fire” in Twin Peaks. 

20th Century – Pre-Series (1900–1988) 

  • 1928: The Great Northern Hotel opens.
  • July 16, 1945: The Trinity Test atomic explosion in New Mexico creates a breach between worlds, releasing BOB and other entities, and triggering the “birth” of a counter-force (implied to be Laura Palmer).
  • 1956: A “frog-moth” creature enters a young girl in New Mexico; a mysterious Woodsman kills a radio DJ, spreading a paralyzing chant.
  • 1967 (Dec 25): Dale Cooper begins keeping his audiotape journal for Diane.
  • 1971 (July 22): Laura Palmer is born.
  • 1982-1985: Dale Cooper and Windom Earle play chess; Earle goes insane, kills his wife (Caroline), and wounds Cooper.
  • 1983: Andrew Packard brings Josie home; Andrew is later killed in a plot with Thomas Eckhardt.
  • 1987: Agent Phillip Jeffries disappears in Buenos Aires, appearing briefly at the FBI Philadelphia office to warn them about Cooper and BOB. 

The Critical Year (1988–1989) 

  • July 1983 – February 1989: Laura Palmer writes in her secret diary.
  • February 9, 1988: Fire Walk with Me events begin. Teresa Banks is murdered in Deer Meadow (the original “wrapped in plastic” case).
  • February 23, 1989: Leland Palmer (possessed by BOB) rapes Laura.
  • February 23-24, 1989: Laura Palmer is murdered.
  • February 24, 1989: Pete Martell finds Laura “wrapped in plastic”. Agent Cooper arrives.
  • March 1989: Seasons 1 & 2 occur, covering about 4 weeks. Laura’s murderer (Leland/BOB) is revealed and dies.
  • March 1989: Cooper enters the Black Lodge to save Annie Blackburn; Cooper’s doppelganger (possessed by BOB) escapes into the world. 

The Gap and The Return (1990–2017)

  • 1990-2015: Cooper’s doppelganger lives a life of crime, avoiding returning to the Black Lodge.
  • 1997: Douglas Jones (a, presumably artificial, entity) has a car accident.
  • 2016 (September-October): The events of Twin Peaks: The Return (Season 3) occur. The doppelganger attempts to avoid being pulled back into the Lodge, while the “good” Cooper tries to return to the real world.
  • 2016/2017: A new, altered timeline is created when Cooper prevents Laura’s murder in 1989, potentially erasing the events of the first two seasons, leading to the existence of “Carrie Page” in Odessa, Texas.
  • September 2017: The Final Dossier is published, wrapping up the fates of the townspeople in the altered timeline. 

Twin Peaks Story Overview and Timeline by Era

HPE NonStop ViewSys Overview and Timeline by Era

ViewSys is a legacy, interactive system monitoring utility for HPE NonStop servers that provides real-time visibility into system resource utilization. Similar to PEEK and Measure, it allows system operators to view resource consumption as it happens, allowing for immediate analysis of the impacts of process relocations or controller path changes. 

HPE NonStop ViewSys Overview

  • Purpose: Monitors system resources, including processor utilization, I/O performance, and memory usage, on NonStop systems.
  • Key Features: Provides online viewing of system resources, allowing for quick recognition of performance bottlenecks, which helps in performance tuning.
  • Functionality: Unlike Measure, which is typically analyzed offline, ViewSys offers an interactive, live, and graphical view of system performance.
  • Operation Requirement: Runs from HPE block mode terminals or non-Stop terminal emulators, presenting average resource usage for each polling interval. 

Detailed Historic Timeline: ViewSys & NonStop Monitoring Evolution

The history of ViewSys is deeply intertwined with the development of the HPE NonStop OS and its monitoring toolkit.

Era 1: Tandem Era (The Early Days)

  • 1976: Initial Tandem NonStop System introduced; basic system monitoring is manual and console-based.
  • 1980s (Mid-late): As Transaction Monitoring Facility (TMF) and Pathway are introduced, the need for interactive monitoring grows.
  • 1990s: ViewSys becomes a key utility for operators managing massive OLTP (Online Transaction Processing) workloads. 

Era 2: Compaq/Early HP Era (The Transition)

  • 1997: Compaq Acquires Tandem.
  • 2003: HP Acquires Compaq. The monitoring focus begins to merge with Integrity-based architecture.
  • 2004: The ViewSys User’s Guide highlights ViewSys alongside PEEK and Measure, standardizing its use for interactive monitoring.
  • 2005: Introduction of HP Integrity “NonStop i” (TNS/E) servers using Intel Itanium processors. ViewSys adapted to monitor Itanium systems. 

Era 3: Modern HPE Era (The Modernization) 

  • 2014: First NonStop X (TNS/X) systems on x86-64 are introduced. ViewSys remains a available tool, but modernization efforts begin.
  • 2015: Hewlett Packard Enterprise (HPE) is formed.
  • 2016-2020: Shift towards Web ViewPoint Enterprise (by Idelji Corporation), which provides web-based dashboards for monitoring EMS events and system metrics.
  • 2020: Sales of Itanium-based systems end. Modern monitoring focuses heavily on NonStop X systems and virtualized environments.
  • Present: While legacy ViewSys may exist in older environments, it is largely superseded by modern GUI-based, browser-independent monitoring solutions like Web ViewPoint and Remote Analyst. 

HPE NonStop ViewSys Overview and Timeline by Era