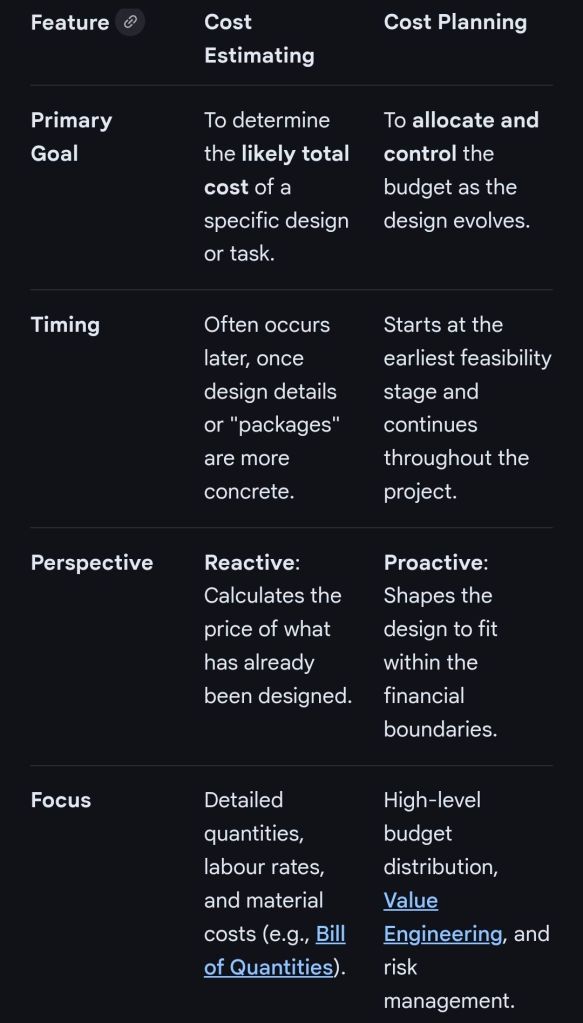
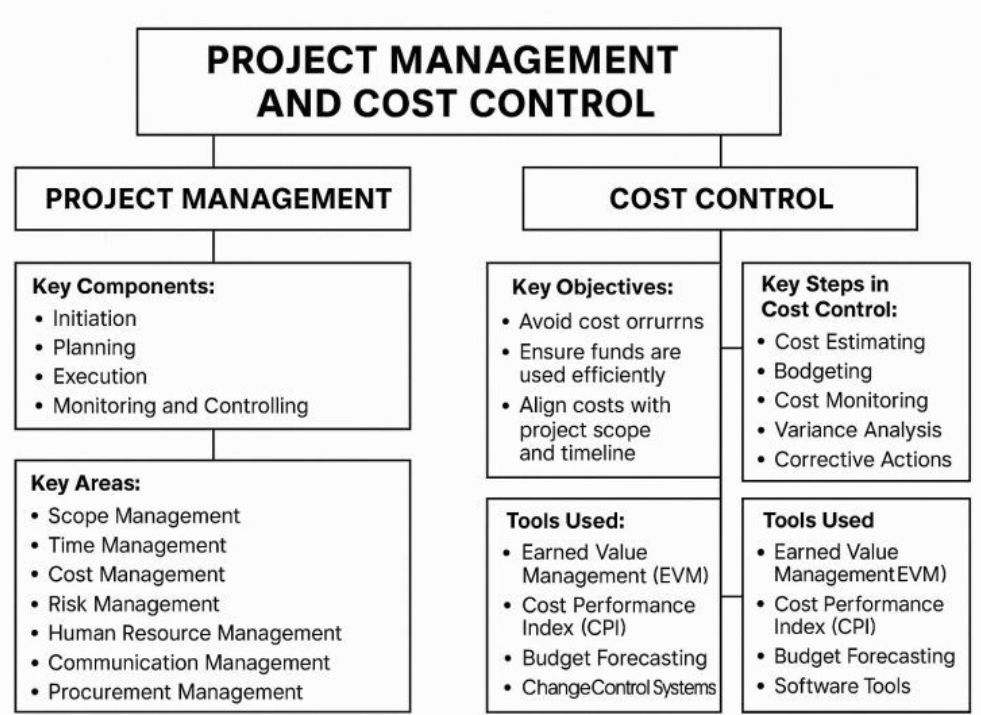
In professional project management and construction, cost estimating and cost planning are complementary processes that occur at different stages to ensure a project remains financially viable.
1. Cost Estimating: “What will it cost?”
Cost estimating is a technical assessment used to predict the expenditures for a project.
Early Stages: Estimates might be “rough orders of magnitude” based on square footage or historical data (e.g., cost per hotel room).
Later Stages: Estimates become precise “tender figures” used by contractors to bid on work, factoring in current market rates for labour and materials.
Function: It answers the question: “Is this specific plan affordable?”.
2. Cost Planning: “How do we stay on budget?”
Cost planning is a strategic framework that manages a project’s financial health from start to finish.
Iterative Process: It is a “living document” that is updated as the project moves from concept to detailed design.
Allocation: It breaks down the total budget into “elemental” targets (e.g., spending £X on the foundation and £Y on finishes).
Control: If an estimate for one part of the project exceeds its target, the cost plan guides the team to adjust the design or find savings elsewhere to keep the overall project on track.
Standard Professional Guidance
The Royal Institution of Chartered Surveyors (RICS) provides the New Rules of Measurement (NRM 1), which standardises how these processes work together:
Order of Cost Estimate: Establishing the initial viability of a project.
Elemental Cost Plan: Breaking the estimate down into functional parts.
Cost Checking: Continually comparing design changes against the cost plan to prevent overspending.
Microsoft Excel has evolved from a niche Apple Macintosh tool into the world’s most dominant spreadsheet software. Its history is marked by strategic shifts, such as jumping from the MS-DOS era to graphical interfaces to outmanoeuvre then-leader Lotus 1-2-3.
Timeline of Major Excel Milestones
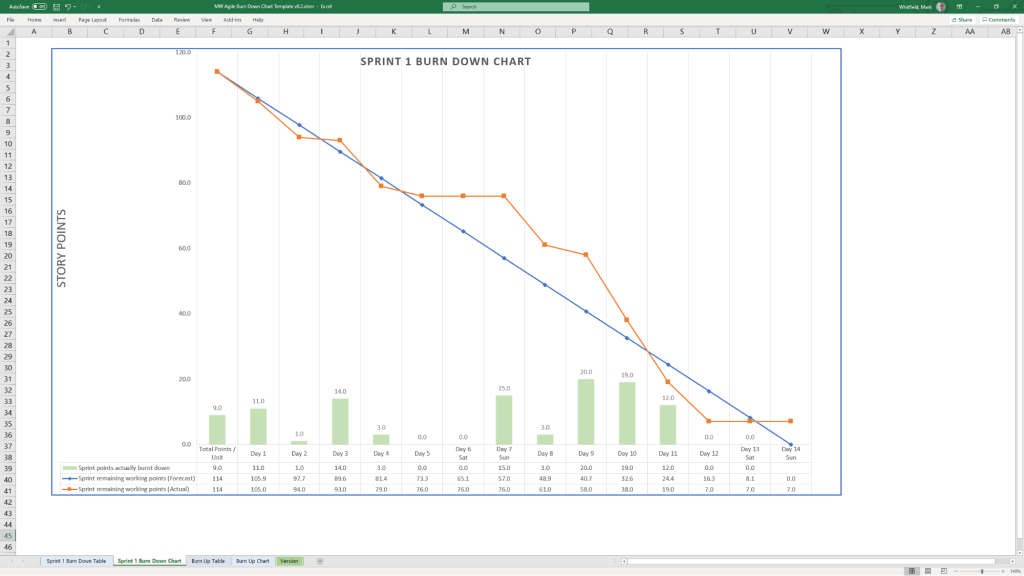
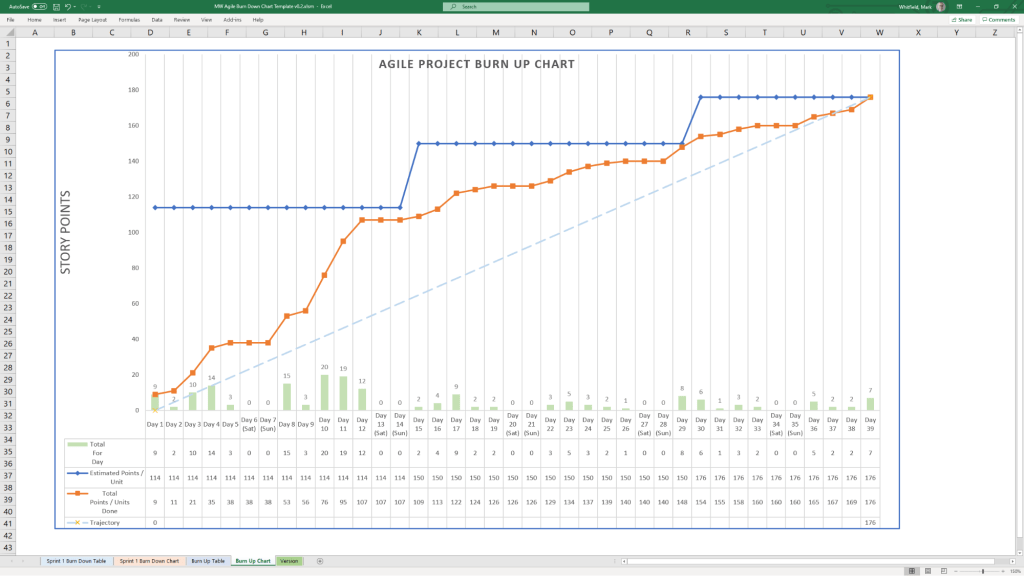
Agile Templates available at download link at website banner
1982: Multiplan (The Predecessor) – Microsoft’s first spreadsheet program. While popular on CP/M systems, it struggled against Lotus 1-2-3 on MS-DOS.
1985: Excel 1.0 (Macintosh Exclusive) – Realising they couldn’t beat Lotus on DOS, Microsoft built a graphical spreadsheet for the new Mac. It introduced the ability to adjust cell heights, widths, and fonts.
1987: Excel 2.0 (First Windows Version) – Launched alongside the first Windows environments, it introduced color support (like red for negative numbers) and was significantly faster than competitors.
1990: Excel 3.0 – Added 3D charts, toolbars, and drawing tools, helping Excel finally overtake Lotus 1-2-3 as the market leader.
1997: Excel 8.0 (Office 97) – Introduced the Paperclip Assistant (“Clippy”) and the first version of the modern VBA environment.
2007: Excel 12.0 (The Ribbon Era) – Replaced menus with the Ribbon interface and dramatically increased grid capacity to 1,048,576 rows by 16,384 columns.
2010: Excel 14.0 – Introduced Slicers for PivotTables and Sparklines (mini charts inside cells).
2013-2016: Data Intelligence – Added Power Query, Power Pivot, and new chart types like Waterfall, Pareto, and Treemap to support advanced data modeling.
2019-Present: AI & Cloud Integration – Modern versions focus on seamless collaboration, dynamic arrays (like XLOOKUP), and AI-powered insights that can extract data directly from images.
Technological Evolution Highlights
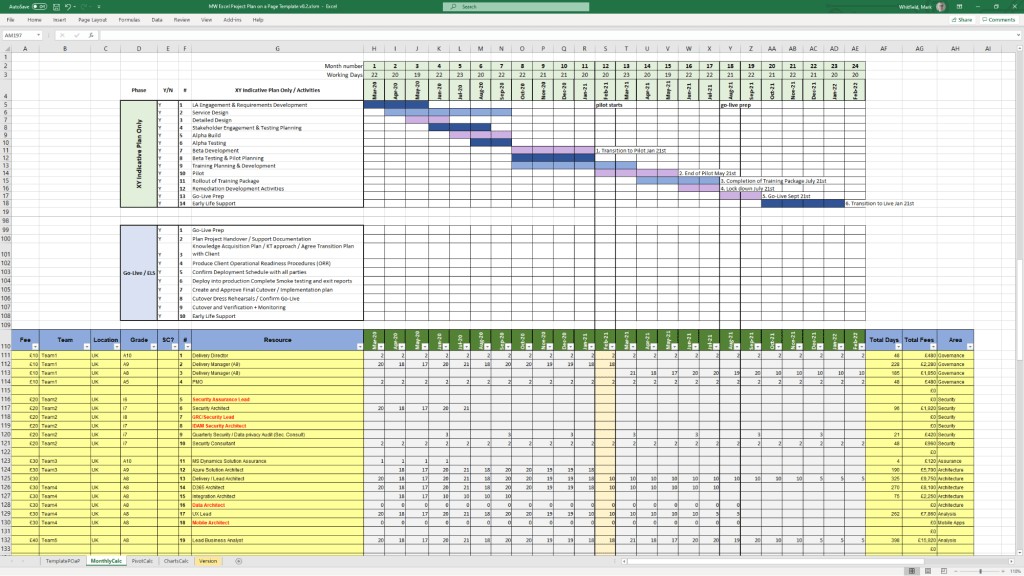
MS Excel templates available on bundle download at website banner
Architecture: Shifted from 16-bit to 32-bit with Excel 95, greatly improving stability.
Collaborative Features: Modern Version History and “Show Changes” now allow teams to track every edit in real-time.
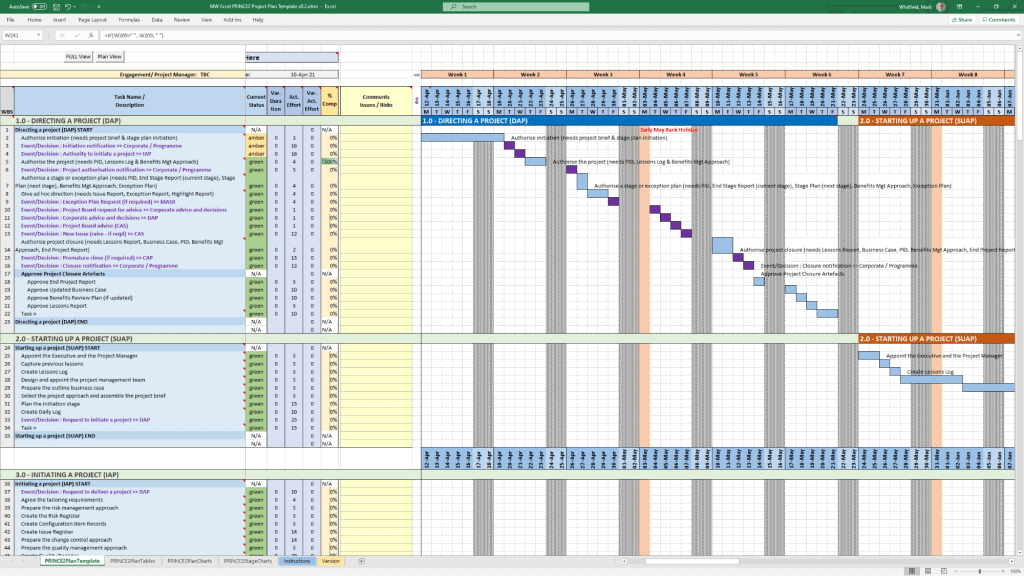
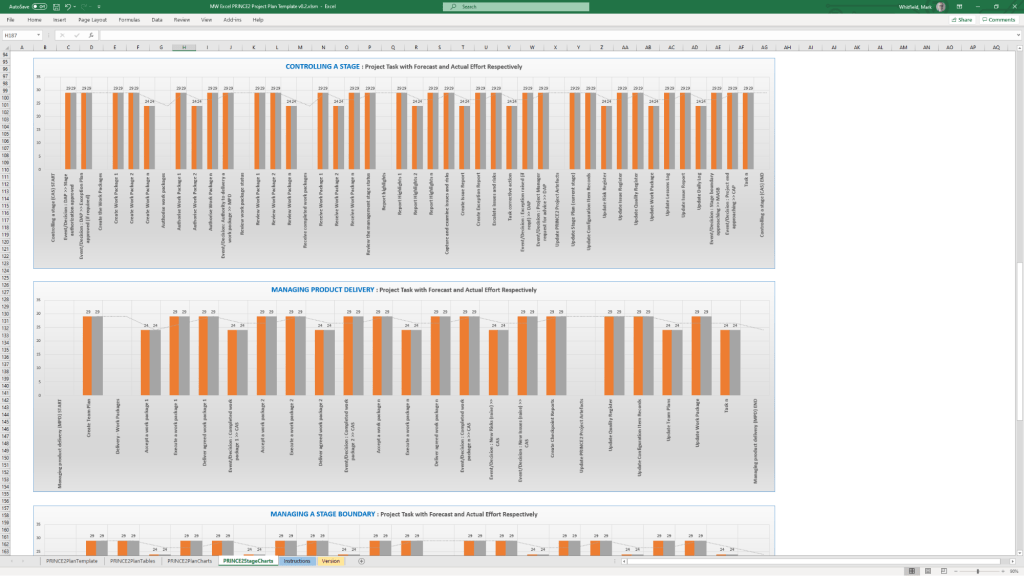
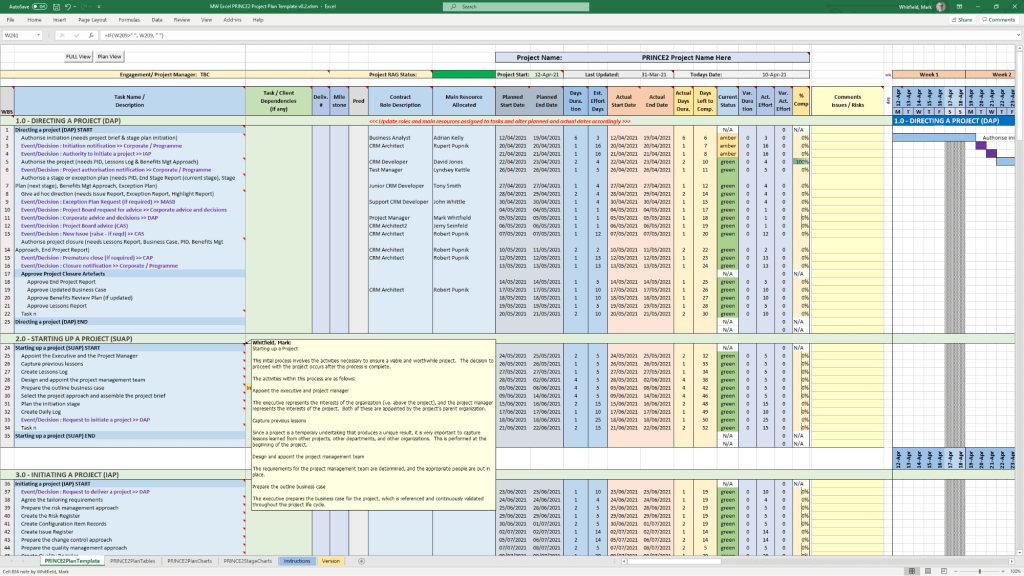
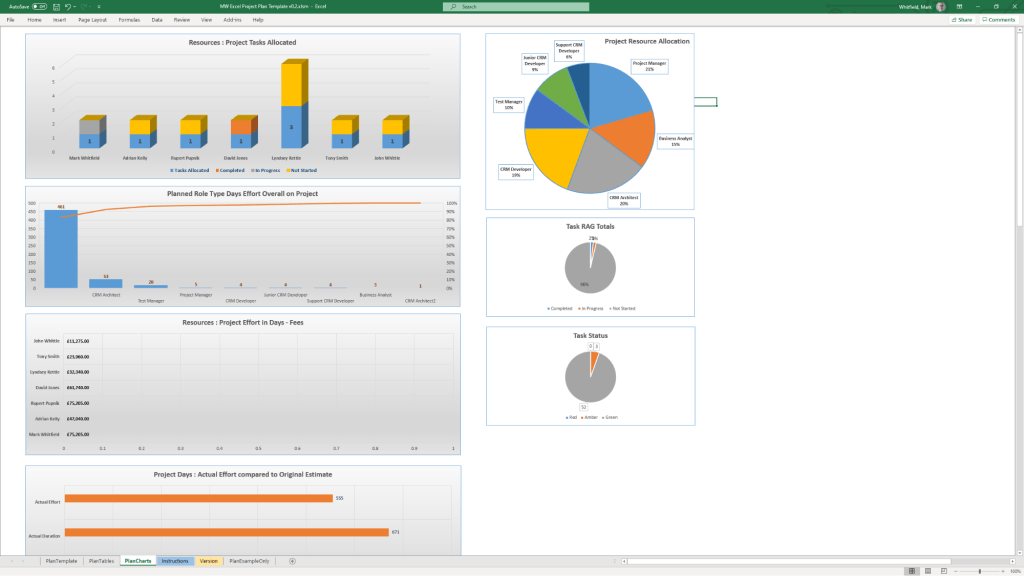
Visualisation: Excel now supports complex timelines via SmartArt or custom Scatter charts with error bars for professional project tracking.
Microsoft Excel Development Timeline History
Microsoft Excel templates available at banner above, FREE upgrades