Critical Path Method CPM Overview and Timeline by year

The Critical Path Method (CPM) is a mathematical algorithm used for scheduling a set of project activities. It identifies the longest sequence of dependent tasks required to complete a project, which in turn determines the shortest possible duration to finish it. 

Timeline of the Critical Path Method

The evolution of CPM is categorised into four primary eras, moving from manual mathematical foundations to modern AI-driven automation. 

1. Pre-Formalisation Era (1940s – Early 1950s) 

  • 1940–1943: DuPont develops precursor techniques for scheduling that are applied to the Manhattan Project.
  • Early 1950s: Growing complexity in industrial plants leads to “scheduling crises,” where traditional Gantt charts are no longer sufficient for managing thousands of interdependent tasks. 

2. The Development & Mainframe Era (1956 – 1969)

  • 1956: Morgan R. Walker of DuPont and James E. Kelley Jr. of Remington Rand begin collaborative research to improve plant maintenance scheduling.
  • 1957–1958: The duo formalises the Critical Path Method (CPM).
  • 1958: The U.S. Navy and Booz Allen Hamilton develop the Program Evaluation and Review Technique (PERT) for the Polaris missile program; it is from this project that the term “critical path” is actually coined.
  • 1959: The first computer-based CPM is implemented on a UNIVAC mainframe, allowing DuPont to reduce plant maintenance downtime from 125 to 78 hours.
  • 1966: CPM is used for the first time in a massive skyscraper project for the construction of the World Trade Center Twin Towers in New York City. 

3. The PC Revolution & Methodology Expansion (1970s – 1999) 

  • 1970s: Dedicated project management software companies like Oracle (then Software Development Laboratories) begin to emerge.
  • 1984: Eliyahu M. Goldratt introduces the Theory of Constraints (TOC), which later influences the development of the Critical Chain.
  • 1980s: The advent of the Personal Computer (PC) makes CPM accessible to smaller companies, moving it away from expensive, bulky mainframes.
  • 1997: Eliyahu M. Goldratt introduces Critical Chain Project Management (CCPM), a more sophisticated evolution of CPM that accounts for resource constraints and buffers. 

4. Modern Era: Digital Integration & AI (2000 – Present) 

  • 2000s–2010s: CPM becomes a standard feature in cloud-based tools like Asana, Wrike, and Microsoft Project, allowing for real-time schedule updates.
  • 2020: The COVID-19 pandemic accelerates the adoption of virtual project management tools, where CPM is used to manage remote, globally distributed teams.
  • 2025–Present: Artificial Intelligence is increasingly used to predict risks and automatically calculate “crashing” scenarios (reducing task duration to shorten the overall project) based on historical data.
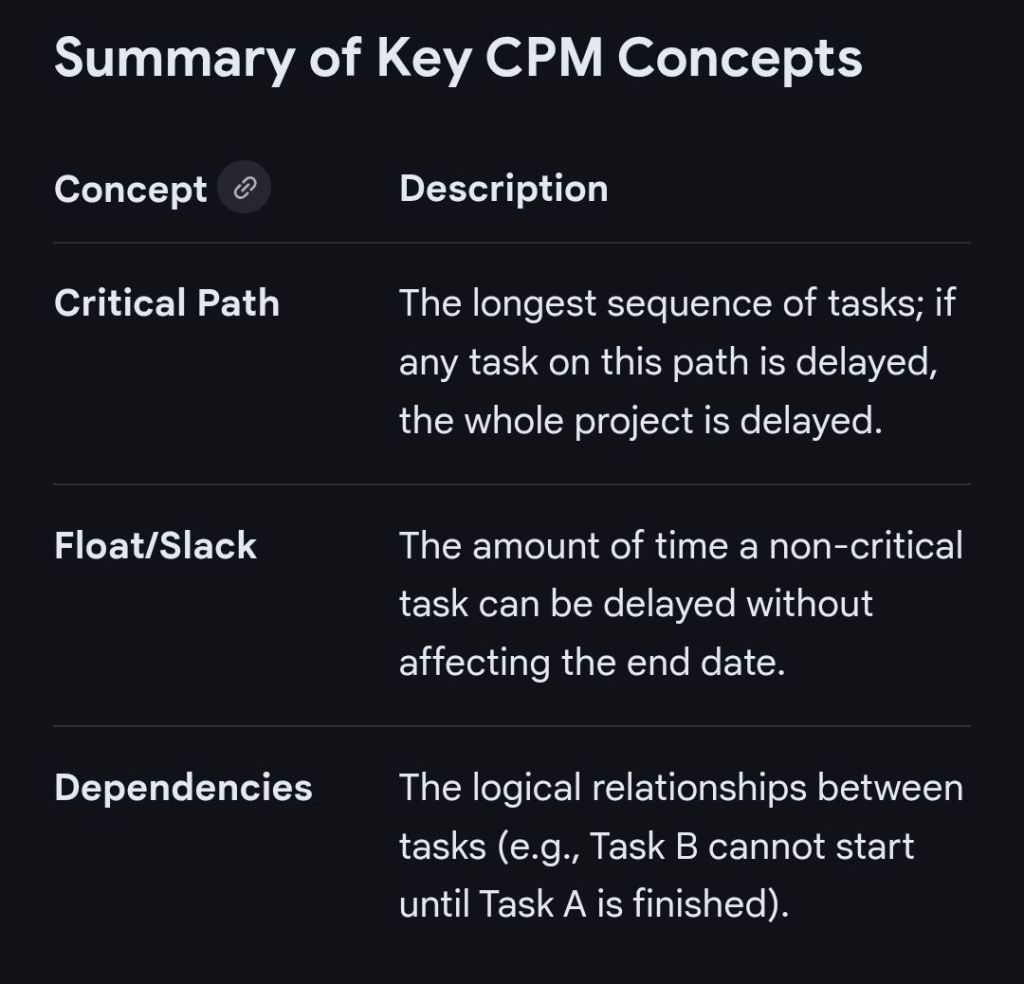
Summary of Key CPM Concepts

Critical Path Method CPM Overview and Timeline by year
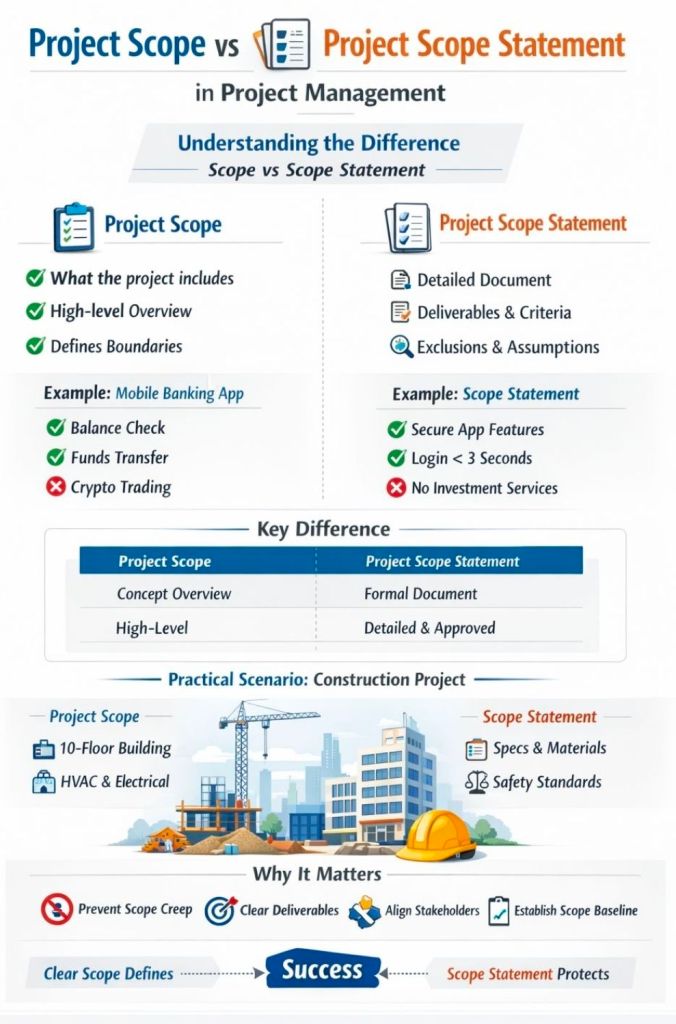
Project Scope vs Project Scope Statement in Project Management

Project Scope vs Project Scope Statement in Project Management

Program Evaluation and Review Technique (PERT) Timeline by era and year

The Program Evaluation and Review Technique (PERT) is a statistical project management tool designed to analyse and represent the tasks involved in completing a project. It is particularly effective for large-scale, complex, and non-routine initiatives—such as Research and Development (R&D)—where task durations are uncertain. 

Overview of PERT

  • Purpose: To identify the critical path and the minimum time required to complete a project.
  • Core Mechanism: Uses a three-point estimation method for each task:
    • Optimistic time (O): The shortest possible time.
    • Most likely time (M): The most realistic duration.
    • Pessimistic time (P): The longest time if major setbacks occur.
  • Formula: The Expected Time () is calculated as .
  • Visualisation: Tasks are represented as nodes (circles or rectangles) and dependencies as arrows.

Timeline History by Era

The history of PERT is defined by its transition from a secretive Cold War military tool to a foundational standard in global project management.

1. The Era of Inception (1956–1959)

This era was marked by the urgent need for a massive deterrent during the Cold War. 

  • 1956: The Polaris Project (Fleet Ballistic Missile program) began, facing the immense challenge of building nuclear-powered submarines capable of launching solid-propellant missiles.
  • 1958: PERT was officially developed by the U.S. Navy Special Projects Office, specifically by Charles E. Clark. It was initially called “Program Evaluation Research Task”.
  • 1958: Around the same time, the Critical Path Method (CPM) was independently developed by the DuPont Corporation.
  • 1959: The technique was renamed to “Program Evaluation and Review Technique”. 

2. The Era of Expansion & Mandates (1960–1975)

During this period, PERT moved from military use into government mandates and international visibility. 

  • 1960: The Polaris program, managed via PERT, achieved its first successful underwater launch and was completed 18 months to two years ahead of schedule.
  • 1962: The U.S. Department of Defense mandated the Work Breakdown Structure (WBS) as part of the PERT approach for all future projects of this size.
  • 1965–1968: One of the first large-scale civilian applications of PERT occurred during the planning of the Winter Olympic Games in Grenoble, France.
  • Late 1960s: PERT was adopted by major public programs globally, including the UK’s nuclear power programs and Sweden’s fighter jet development. 

3. The Era of Professionalization (1976–1999)

Project management began to coalesce into a formal academic and professional discipline. 

  • 1987: The Project Management Institute (PMI) published the first PMBOK Guide (Project Management Body of Knowledge), which included and standardised PERT and CPM concepts.
  • 1989: Earned Value Management (EVM), which grew out of early PERT/Cost frameworks, became a mandatory part of U.S. government procurement.
  • 1998: The PMBOK Guide was recognised as a standard by the American National Standards Institute (ANSI). 

4. The Modern Era (2000–Present)

PERT has transitioned from hand-drawn charts to being integrated into digital ecosystems. 

  • 2000s: PERT concepts became core features in project management software (like Microsoft Project), where the math is often automated behind the user interface.
  • 2020s: Emerging trends include AI-enhanced estimations, where machine learning algorithms analyse historical project data to generate the optimistic, pessimistic, and most likely time estimates more accurately than human experts.

Program Evaluation and Review Technique (PERT) Timeline by era and year

Gantt Chart Detailed Timeline History by Era and Year

Henry Gantt (1861–1919) was an American mechanical engineer and management consultant who revolutionized project management by introducing visual tools to track work against time. A close associate of Frederick Taylor, he humanized “scientific management” by focusing on employee motivation and social responsibility alongside industrial efficiency. 

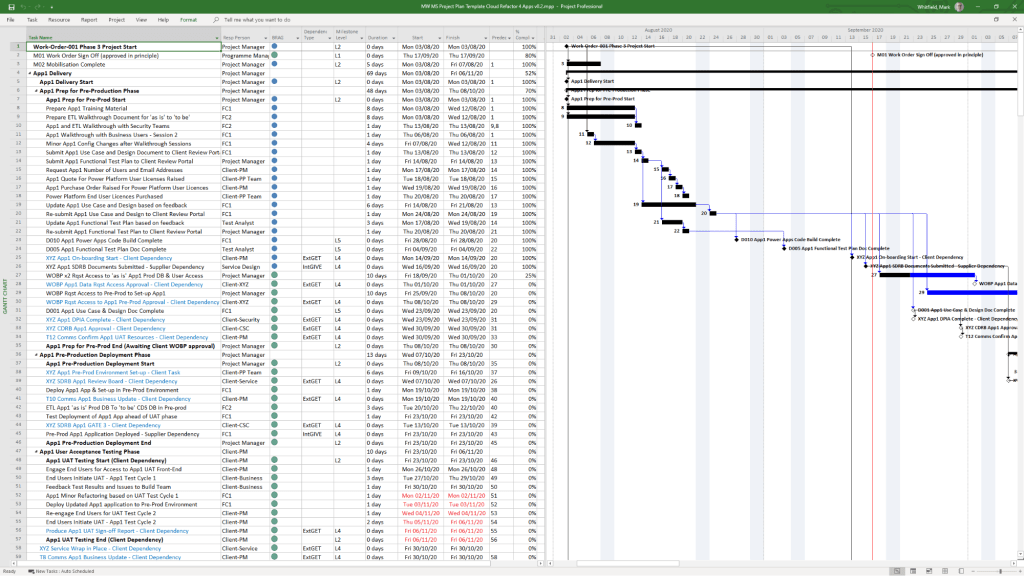
Gantt Chart in MS Project, templates can be downloaded at website banner link

Overview of Henry Gantt’s Contributions

  • The Gantt Chart: His most famous invention, a horizontal bar chart that illustrates a project schedule, including task durations and progress.
  • Task and Bonus System: A wage system that guaranteed a base rate but offered bonuses to workers who exceeded daily production goals.
  • Social Responsibility: He argued that businesses have a moral obligation to the welfare of the society in which they operate, not just to their owners.
  • Industrial Efficiency: He advocated for using scientific analysis to eliminate “chance and accidents” in manufacturing. 

Comprehensive Gantt Timeline History

Era 1: Pre-Gantt & Early Origins (1765–1896)

  • 1765: Joseph Priestley creates early timeline charts, which some consider the conceptual distant ancestors of the Gantt chart.
  • 1896: Polish engineer Karol Adamiecki develops the “Harmonogram,” a precursor that displayed interdependent processes. However, he published it only in Polish and Russian, limiting its global recognition. 

Era 2: The Henry Gantt Era (1903–1919)

  • 1903: Henry Gantt develops his first version of a production chart for the American Locomotive Company.
  • 1910–1915: Gantt refines and popularizes his chart through articles and his book Work, Wages and Profits (1910).
  • 1917–1918: At the request of General William Crozier, Gantt charts are used to manage massive military production for the U.S. during World War I.
  • 1919: Henry Gantt passes away. 

Era 3: Global Adoption & Infrastructure (1920s–1970s) 

  • 1922: Wallace Clark, a colleague of Gantt, publishes The Gantt Chart: A Working Tool of Management, leading to international adoption.
  • 1929: Walter Polakov introduces Gantt charts to the Soviet Union for their First Five Year Plan.
  • 1931–1936: Gantt charts are used on massive infrastructure projects like the Hoover Dam and later the U.S. Interstate highway system.
  • 1940s: Extensively used for logistics and military project management during World War II.
  • 1950s: Become a staple in the construction and engineering industries; the first digital predecessors like PERT and Critical Path Method (CPM) emerge. 

Era 4: The Digital Revolution (1980s–Present) 

  • 1980s: The advent of personal computers allows project managers to create and update charts without redrawing them by hand.
  • 1990s: Software like Microsoft Project adds “link lines” to display complex dependencies between tasks.
  • 2000s–2010s: Web-based and cloud-based applications (like Jira or Asana) integrate Gantt charts for real-time team collaboration.
  • Present: Modern tools use AI to automate chart maintenance and predict risks based on historical data.

Gantt Chart Detailed Timeline History by Era and Year

Research Machines Limited, Link Timeline History by Era and Device

Research Machines (now RM plc) has a long-standing history as a primary provider of technology for the UK education sector. Founded in 1973, the company transitioned from a hobbyist component supplier to a leading manufacturer of educational microcomputers and networking systems. 

Overview of Research Machines “LINK”

The LINK designation primarily referred to the RM Link 480Z, introduced in 1982. It was designed as a lower-cost, diskless network station that could “link” into a chain, typically using a more powerful 380Z as a file server. This system was one of three chosen for the UK government’s 1982 Educational Scheme. 


Timeline History by Era and Device

The Founding Era (1973–1976)

  • 1973: Founded as Research Machines Limited in Oxford by Mike Fischer and Mike O’Regan.
  • 1974: Operated under the name Sintel, a mail-order supplier of electronic components for hobbyists. 

The Z80 Era (1977–1984)

  • 1977: Launched the RML 380Z, an 8-bit microcomputer based on the Zilog Z80 processor. It typically ran the CP/M operating system and was often housed in a distinctive large black metal case.
  • 1982: Introduced the RM Link 480Z.
    • Purpose: Designed as a diskless network node for schools.
    • Networking: Used the proprietary CHAIN Network or Z-Net to connect to a 380Z file server.
    • Hardware: Featured a Z80 CPU and up to 256 KB of bank-switched RAM. Early models had black metal cases, later replaced by cream plastic. 

The Nimbus & PC Transition (1985–1990s) 

  • 1985: Launched the RM Nimbus PC-186, using the Intel 80186 processor. While not fully IBM-compatible, it could run early versions of Microsoft Windows (up to 3.0).
  • 1986: Released the RM AX (using the Intel 80286), often used as a file server for Nimbus networks.
  • Late 1980s: Introduced the M Series (PC-286/386) and S Series (PC-386 and later), which were fully IBM PC compatible. 

The PC Era & Diversification (1994–Present)

  • 1994: Floated on the London Stock Exchange as RM plc.
  • 1997: Introduced the C Series of computers for schools.
  • 2003: Launched the F Series (blue chassis) pre-installed with Windows XP.
  • 2010: Released a new line of black and silver RM computers for Windows 7.
  • Current: RM has pivoted from hardware manufacturing to becoming a global EdTech solutions provider, focusing on digital assessment (RM Ava) and managed IT services.

Research Machines Limited, Link Timeline History by Era and Device

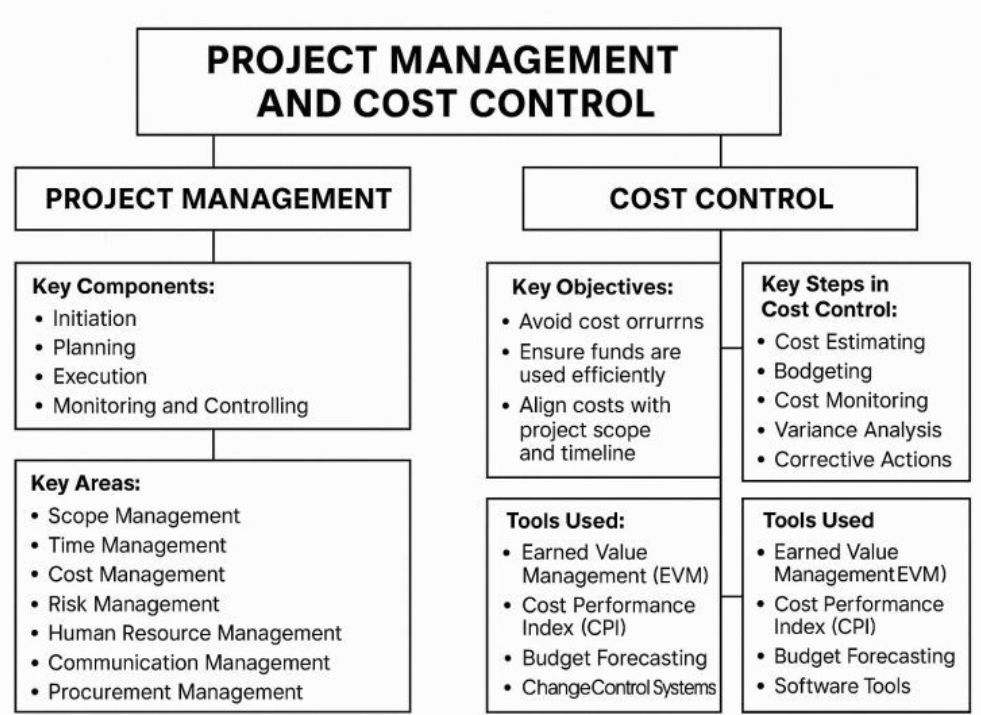
Project Management and Cost Control

Project Management and Cost Control

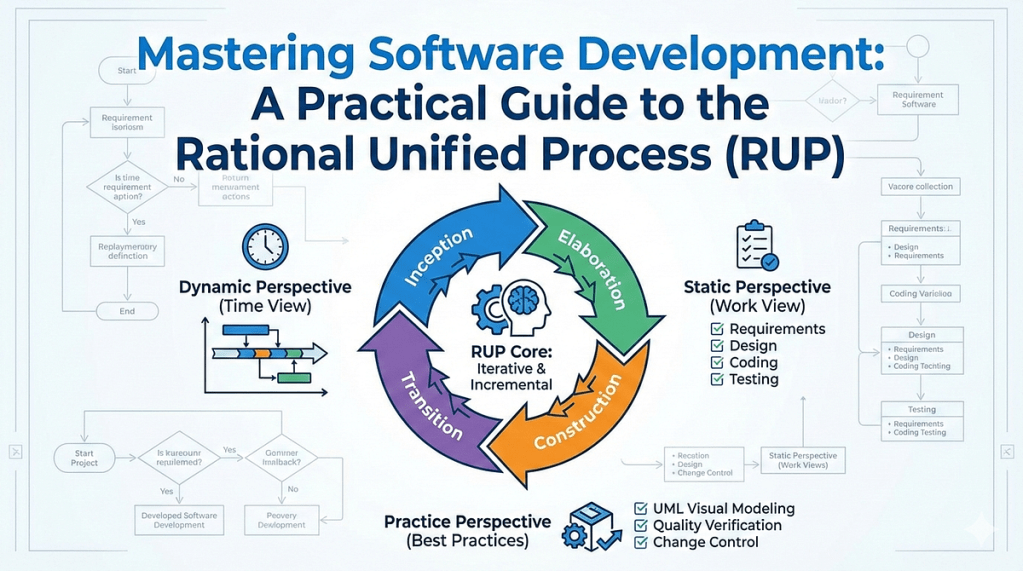
Rational Unified Process RUP Overview and Timeline History

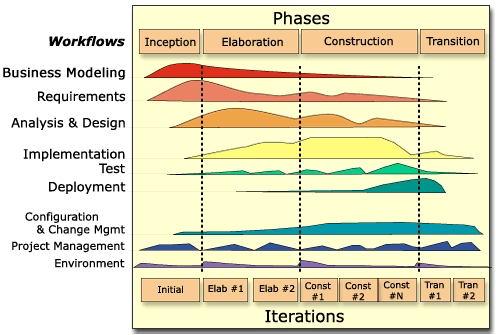
The Rational Unified Process (RUP) timeline is a two-dimensional framework where the horizontal axis represents time (divided into phases and iterations) and the vertical axis represents work/activities (divided into disciplines). 

Rational Unified Process, RUP

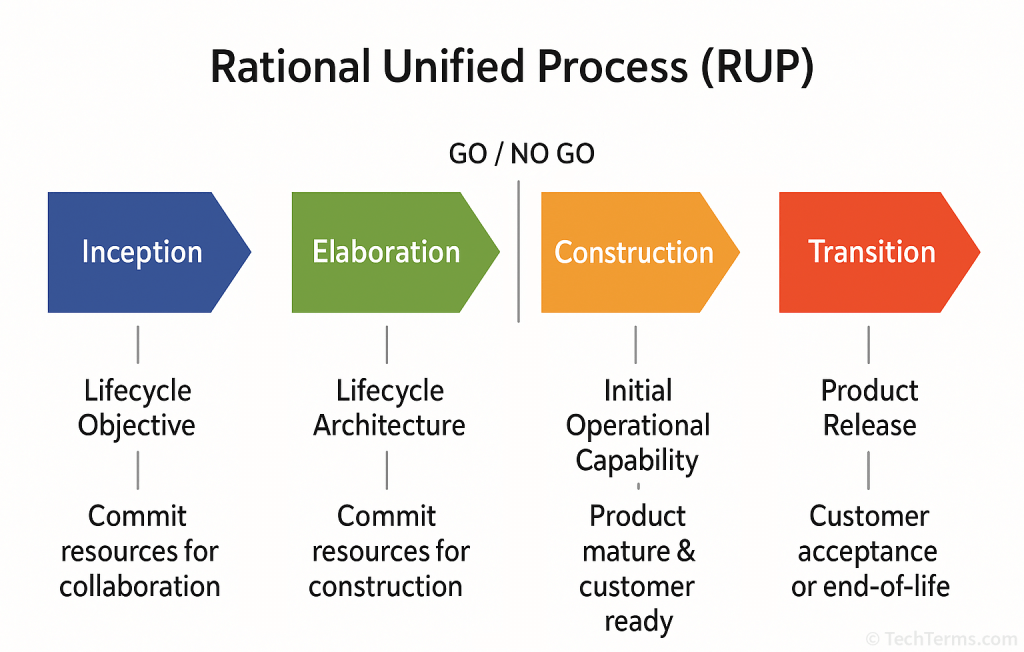
The process is structured into four sequential phases, each culminating in a major milestone where the project’s progress is assessed before moving forward. 

RUP Phases, Iterations and Workflows

RUP Project Phases and Milestones

Each phase of the RUP lifecycle has a specific objective and a corresponding milestone. 

  • Inception Phase
    • Goal: Define project scope, identify business risks, and establish the Business Case.
    • Milestone: Lifecycle Objective Milestone – Stakeholders agree on scope and cost/schedule estimates.
  • Elaboration Phase
    • Goal: Analyze requirements in detail and design a stable Software Architecture.
    • Milestone: Lifecycle Architecture Milestone – The architecture is validated and major risks are mitigated.
  • Construction Phase
    • Goal: Build the software system by developing and testing all components and features.
    • Milestone: Initial Operational Capability Milestone – A product is ready for beta testing by users.
  • Transition Phase
    • Goal: Deploy the software to the end users and perform final Beta Testing and training.
    • Milestone: Product Release Milestone – The development cycle is finished and the product is formally accepted. 

Detailed Iteration Timeline

Within each phase, work is performed in iterations (typically lasting 2 to 6 weeks). Each iteration is a mini-lifecycle that includes: 

  1. Requirements Analysis: Refining what needs to be built.
  2. Design: Modeling the system architecture and components.
  3. Implementation: Writing the code for specific features.
  4. Testing: Verifying the quality of the iteration’s output.
  5. Assessment: Evaluating the iteration against its planned goals. 

Historical Development Timeline

  • 1988: Objectory AB defines the core process.
  • 1995: Rational Software Corporation acquires Objectory.
  • 1998: RUP 5.0 is released, introducing UML integration.
  • 2003: IBM acquires Rational Software.
  • 2012: RUP is largely succeeded by Disciplined Agile Delivery (DAD) and SAFe.

Rational Unified Process RUP Overview and Timeline History

A Practical Guide to the Rational Unified Process RUP

ISO 9001 Quality Assurance Detailed Timeline History by year

ISO 9001 is founded on seven core Quality Management Principles (QMPs) designed to guide organisations toward improved performance and consistent quality. Its history is a progression from rigid, procedure-heavy military-style standards to flexible, risk-based management systems. 

Core Principles of ISO 9001:2015

These seven principles form the foundation of the current standard: 

  • Customer Focus: Meeting and exceeding customer expectations is the primary focus to drive loyalty and revenue.
  • Leadership: Leaders at all levels establish unity of purpose and direction, creating an environment where people are engaged.
  • Engagement of People: Competent, empowered, and engaged people across all levels are essential to enhance the organisation’s value.
  • Process Approach: Understanding activities as interrelated processes that function as a coherent system leads to more predictable results.
  • Improvement: A permanent objective of every successful organisation is the continual improvement of its performance.
  • Evidence-based Decision Making: Decisions based on the analysis and evaluation of data are more likely to produce desired results.
  • Relationship Management: Managing relationships with interested parties, such as suppliers and partners, optimizes their impact on performance. 

Detailed Timeline History

The evolution of ISO 9001 can be categorised into four distinct eras: 

1. The Pre-ISO Foundations (1950s – 1986)

  • 1959: US and UK military departments establish MIL-SPECS for procurement.
  • 1969: NATO AQAP standards are introduced for defense industry mutual recognition.
  • 1971: The British Standards Institution (BSI) releases BS 9000 for the electronics industry.
  • 1979: BS 5750 is published in the UK, becoming the first general-purpose quality management standard for industry. 

2. The Procedural & Quality Assurance Era (1987 – 1999)

  • 1987 (ISO 9001:1987): First international publication. Focused on quality assurance through procedural controls and final product inspections. Three models existed: 9001 (Design/Production), 9002 (Production), and 9003 (Inspection).
  • 1994 (ISO 9001:1994): First revision. Shifted focus toward preventative actions rather than just checking finished products. However, it remained “document-heavy,” often leading to excessive bureaucracy. 

3. The Process Management Era (2000 – 2014)

  • 2000 (ISO 9001:2000): A major overhaul. Consolidated ISO 9001, 9002, and 9003 into a single standard. Introduced the Process Approach and the original eight Quality Management Principles.
  • 2008 (ISO 9001:2008): A minor update focusing on clarification and consistency with other standards like ISO 14001 (Environment). No new requirements were added. 

4. The Risk-Based & Strategy Era (2015 – Present)

  • 2015 (ISO 9001:2015): Introduced Risk-Based Thinking and the High-Level Structure (HLS) to ease integration with other management systems. It reduced prescriptive documentation requirements, focusing instead on organisational context and leadership accountability.
  • 2026 (Upcoming): The next major revision is currently under development (target: September 2026), expected to address digitalisation, sustainability (ESG), and climate change.

ISO 9001 Quality Assurance Detailed Timeline History by year